Simpson County, Kentucky
| Simpson County, Kentucky | |
|---|---|
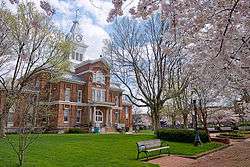 Old Simpson County Courthouse in Franklin | |
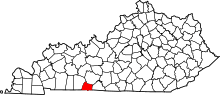 Location in the U.S. state of Kentucky | |
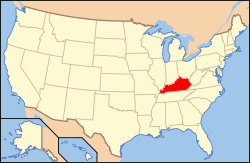 Kentucky's location in the U.S. | |
| Founded | 1819 |
| Seat | Franklin |
| Largest city | Franklin |
| Area | |
| • Total | 236 sq mi (611 km2) |
| • Land | 234 sq mi (606 km2) |
| • Water | 2.3 sq mi (6 km2), 1.0% |
| Population | |
| • (2010) | 17,327 |
| • Density | 70/sq mi (30/km2) |
| Congressional district | 1st |
| Time zone | Central: UTC−6/−5 |
| Website |
www |
Simpson County is a county located in the Pennyroyal Plateau region the U.S. state of Kentucky. As of the 2010 census, the population was 17,327.[1] Its county seat is Franklin.[2]
History
Simpson County was established in 1819 from Allen, Logan, and Warren Counties.[3] The county is named for Captain John Simpson, a Kentucky militia officer who fought in Battle of Fallen Timbers in the Northwest Indian War, and was killed during the War of 1812 in the Battle of River Raisin.[4]
Geography
According to the U.S. Census Bureau, the county has a total area of 236 square miles (610 km2), of which 234 square miles (610 km2) is land and 2.3 square miles (6.0 km2) (1.0%) is water.[5]
Adjacent counties
- Warren County (north)
- Allen County (east)
- Sumner County, Tennessee (southeast)
- Robertson County, Tennessee (southwest)
- Logan County (west)
Demographics
| Historical population | |||
|---|---|---|---|
| Census | Pop. | %± | |
| 1820 | 4,852 | — | |
| 1830 | 5,815 | 19.8% | |
| 1840 | 6,537 | 12.4% | |
| 1850 | 7,733 | 18.3% | |
| 1860 | 8,146 | 5.3% | |
| 1870 | 9,573 | 17.5% | |
| 1880 | 10,641 | 11.2% | |
| 1890 | 10,878 | 2.2% | |
| 1900 | 11,624 | 6.9% | |
| 1910 | 11,460 | −1.4% | |
| 1920 | 11,150 | −2.7% | |
| 1930 | 11,336 | 1.7% | |
| 1940 | 11,752 | 3.7% | |
| 1950 | 11,678 | −0.6% | |
| 1960 | 11,548 | −1.1% | |
| 1970 | 13,054 | 13.0% | |
| 1980 | 14,673 | 12.4% | |
| 1990 | 15,145 | 3.2% | |
| 2000 | 16,405 | 8.3% | |
| 2010 | 17,327 | 5.6% | |
| Est. 2016 | 18,083 | [6] | 4.4% |
| U.S. Decennial Census[7] 1790-1960[8] 1900-1990[9] 1990-2000[10] 2010-2013[1] | |||
As of the census[11] of 2000, there were 16,405 people, 6,415 households, and 4,638 families residing in the county. The population density was 70 per square mile (27/km2). There were 7,016 housing units at an average density of 30 per square mile (12/km2). The racial makeup of the county was 87.84% White, 10.22% Black or African American, 0.17% Native American, 0.55% Asian, 0.06% Pacific Islander, 0.30% from other races, and 0.87% from two or more races. 0.91% of the population were Hispanics or Latinos of any race.
There were 6,415 households out of which 33.80% had children under the age of 18 living with them, 56.80% were married couples living together, 11.50% had a female householder with no husband present, and 27.70% were non-families. 24.20% of all households were made up of individuals and 10.40% had someone living alone who was 65 years of age or older. The average household size was 2.52 and the average family size was 2.97.
The age distribution was 26.20% under the age of 18, 8.50% from 18 to 24, 29.20% from 25 to 44, 23.00% from 45 to 64, and 13.10% who were 65 years of age or older. The median age was 36 years. For every 100 females there were 95.30 males. For every 100 females age 18 and over, there were 91.60 males.
The median income for a household in the county was $36,432, and the median income for a family was $42,525. Males had a median income of $32,160 versus $22,667 for females. The per capita income for the county was $17,150. About 8.50% of families and 11.60% of the population were below the poverty line, including 14.00% of those under age 18 and 15.90% of those age 65 or over.
Communities
City
- Franklin (county seat)
Unincorporated communities
Politics
In contrast to the Western Coalfield and the eastern part of the Pennyroyal Plateau, Simpson County was not highly pro-Union during the Civil War.[12] Consequently, Simpson was as reliably Democratic as the Jackson Purchase and Bluegrass during the following century: no Republican carried Simpson County until Richard Nixon’s 1972 landslide. As with all of rural Kentucky, the social liberalism of the Democratic Party – rejected overwhelmingly by southern whites[13] – has made it solidly Republican at least a Presidential level since 2000.
| Year | Republican | Democratic | Third parties |
|---|---|---|---|
| 2016 | 67.4% 5,077 | 28.5% 2,144 | 4.1% 310 |
| 2012 | 61.4% 4,355 | 37.4% 2,650 | 1.2% 88 |
| 2008 | 60.7% 4,437 | 38.0% 2,775 | 1.3% 97 |
| 2004 | 60.7% 4,273 | 38.8% 2,730 | 0.6% 40 |
| 2000 | 54.4% 3,169 | 44.4% 2,583 | 1.2% 72 |
| 1996 | 40.8% 2,186 | 51.3% 2,749 | 7.9% 423 |
| 1992 | 39.0% 2,280 | 48.5% 2,834 | 12.4% 726 |
| 1988 | 55.6% 2,699 | 44.0% 2,138 | 0.5% 22 |
| 1984 | 58.7% 3,073 | 40.9% 2,140 | 0.4% 23 |
| 1980 | 41.9% 2,020 | 56.3% 2,713 | 1.8% 86 |
| 1976 | 34.5% 1,481 | 64.7% 2,782 | 0.8% 36 |
| 1972 | 62.6% 2,285 | 36.3% 1,325 | 1.2% 42 |
| 1968 | 33.1% 1,435 | 34.7% 1,505 | 32.3% 1,399 |
| 1964 | 23.3% 967 | 76.5% 3,168 | 0.2% 9 |
| 1960 | 42.2% 1,927 | 57.8% 2,642 | 0.0% 0 |
| 1956 | 33.4% 1,454 | 66.2% 2,879 | 0.4% 17 |
| 1952 | 32.4% 1,310 | 67.4% 2,724 | 0.2% 6 |
| 1948 | 20.5% 762 | 73.9% 2,752 | 5.6% 210 |
| 1944 | 26.3% 1,012 | 73.3% 2,821 | 0.4% 17 |
| 1940 | 25.0% 987 | 74.8% 2,950 | 0.2% 8 |
| 1936 | 29.0% 1,240 | 70.7% 3,027 | 0.3% 13 |
| 1932 | 24.9% 1,203 | 74.6% 3,603 | 0.4% 21 |
| 1928 | 39.6% 1,635 | 60.4% 2,490 | 0.0% 0 |
| 1924 | 32.1% 1,294 | 66.6% 2,688 | 1.3% 52 |
| 1920 | 34.2% 1,680 | 65.3% 3,206 | 0.4% 21 |
| 1916 | 33.4% 955 | 66.0% 1,887 | 0.6% 16 |
| 1912 | 21.0% 547 | 62.8% 1,639 | 16.3% 424 |
See also
References
- 1 2 "State & County QuickFacts". United States Census Bureau. Retrieved March 6, 2014.
- ↑ "Find a County". National Association of Counties. Retrieved 2011-06-07.
- ↑ Atlas of Historical County Boundaries, Kentucky
- ↑ The Register of the Kentucky State Historical Society, Volume 1. Kentucky State Historical Society. 1903. p. 37.
- ↑ "2010 Census Gazetteer Files". United States Census Bureau. August 22, 2012. Archived from the original on August 12, 2014. Retrieved August 20, 2014.
- ↑ "Population and Housing Unit Estimates". Retrieved June 9, 2017.
- ↑ "U.S. Decennial Census". United States Census Bureau. Retrieved August 20, 2014.
- ↑ "Historical Census Browser". University of Virginia Library. Retrieved August 20, 2014.
- ↑ "Population of Counties by Decennial Census: 1900 to 1990". United States Census Bureau. Retrieved August 20, 2014.
- ↑ "Census 2000 PHC-T-4. Ranking Tables for Counties: 1990 and 2000" (PDF). United States Census Bureau. Retrieved August 20, 2014.
- ↑ "American FactFinder". United States Census Bureau. Retrieved 2008-01-31.
- ↑ Copeland, James E.; ‘Where Were the Kentucky Unionists and Secessionists’; The Register of the Kentucky Historical Society, volume 71, no. 4 (October, 1973), pp. 344-363
- ↑ Cohn, Nate; ‘Demographic Shift: Southern Whites’ Loyalty to G.O.P. Nearing That of Blacks to Democrats’, New York Times, April 24, 2014
- ↑ Leip, David. "Dave Leip's Atlas of U.S. Presidential Elections". uselectionatlas.org. Retrieved 2018-07-06.
Sources
- Simpson County, Kentucky, KyGenWeb.
- Simpson County, Kentucky, Kentucky Atlas & Gazetteer.
Municipalities and communities of Simpson County, Kentucky, United States | ||
|---|---|---|
| City | | |
| Unincorporated communities | ||