Bath County, Kentucky
| Bath County, Kentucky | |
|---|---|
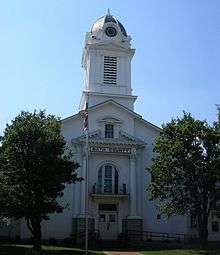 Bath County Courthouse in Owingsville | |
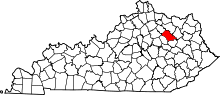 Location in the U.S. state of Kentucky | |
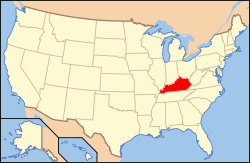 Kentucky's location in the U.S. | |
| Founded | 1811 |
| Named for | Medicinal springs located within the county |
| Seat | Owingsville |
| Largest city | Owingsville |
| Area | |
| • Total | 284 sq mi (736 km2) |
| • Land | 279 sq mi (723 km2) |
| • Water | 5.2 sq mi (13 km2), 1.8% |
| Population | |
| • (2010) | 11,591 |
| • Density | 42/sq mi (16/km2) |
| Congressional district | 6th |
| Time zone | Eastern: UTC−5/−4 |
| Website |
bathcounty |
Bath County is a county located in the U.S. state of Kentucky. As of the 2010 census, the population was 11,591.[1] The county seat is Owingsville.[2] The county was formed in 1811.[3]
Bath County is included in the Mount Sterling, KY Micropolitan Statistical Area, which is also included in the Lexington-Fayette-Richmond-Frankfort, KY Combined Statistical Area.
History
Bath County was established in 1811 from land given by Montgomery County, Kentucky. Its name is derived from natural springs said to have medicinal qualities. The courthouse in Owingsville was destroyed by an accidental fire caused by Union troops during the American Civil War in 1864.[4]
In 1932, an archaeological field survey observed fourteen archaeological sites in Bath County, including the Ramey Mound near Sharpsburg and multiple ancient burials near the Springfield Presbyterian Church.[5]
Geography
According to the U.S. Census Bureau, the county has a total area of 284 square miles (740 km2), of which 279 square miles (720 km2) is land and 5.2 square miles (13 km2) (1.8%) is water.[6]
Adjacent counties
- Fleming County (north)
- Rowan County (east)
- Menifee County (southeast)
- Montgomery County (southwest)
- Bourbon County (west)
- Nicholas County (northwest)
National protected area
- Daniel Boone National Forest (part)
Demographics
| Historical population | |||
|---|---|---|---|
| Census | Pop. | %± | |
| 1820 | 7,961 | — | |
| 1830 | 8,799 | 10.5% | |
| 1840 | 9,763 | 11.0% | |
| 1850 | 12,115 | 24.1% | |
| 1860 | 12,113 | 0.0% | |
| 1870 | 10,145 | −16.2% | |
| 1880 | 11,982 | 18.1% | |
| 1890 | 12,813 | 6.9% | |
| 1900 | 14,734 | 15.0% | |
| 1910 | 13,988 | −5.1% | |
| 1920 | 11,996 | −14.2% | |
| 1930 | 11,075 | −7.7% | |
| 1940 | 11,451 | 3.4% | |
| 1950 | 10,410 | −9.1% | |
| 1960 | 9,114 | −12.4% | |
| 1970 | 9,235 | 1.3% | |
| 1980 | 10,025 | 8.6% | |
| 1990 | 9,692 | −3.3% | |
| 2000 | 11,085 | 14.4% | |
| 2010 | 11,591 | 4.6% | |
| Est. 2016 | 12,327 | [7] | 6.3% |
| U.S. Decennial Census[8] 1790-1960[9] 1900-1990[10] 1990-2000[11] 2010-2013[1] | |||
As of the census[12] of 2000, there were 11,085 people, 4,445 households, and 3,195 families residing in the county. The population density was 40 per square mile (15/km2). There were 4,994 housing units at an average density of 18 per square mile (6.9/km2). The racial makeup of the county was 96.87% White, 1.85% Black or African American, 0.21% Native American, 0.02% Asian, 0.40% from other races, and 0.66% from two or more races. 0.80% of the population were Hispanic or Latino of any race.
There were 4,445 households out of which 32.30% had children under the age of 18 living with them, 57.70% were married couples living together, 10.30% had a female householder with no husband present, and 28.10% were non-families. 25.30% of all households were made up of individuals and 12.00% had someone living alone who was 65 years of age or older. The average household size was 2.47 and the average family size was 2.93.
In the county, the population was spread out with 24.20% under the age of 18, 8.60% from 18 to 24, 28.80% from 25 to 44, 23.80% from 45 to 64, and 14.60% who were 65 years of age or older. The median age was 37 years. For every 100 females, there were 97.60 males. For every 100 females age 18 and over, there were 94.80 males.
The median income for a household in the county was $26,018, and the median income for a family was $31,758. Males had a median income of $27,786 versus $20,986 for females. The per capita income for the county was $15,326. About 16.40% of families and 21.90% of the population were below the poverty line, including 29.60% of those under age 18 and 21.20% of those age 65 or over.
Politics
Voter Registration
| Bath County Voter Registration & Party Enrollment as of November 17, 2015[13] | |||||
|---|---|---|---|---|---|
| Political Party | Total Voters | Percentage | |||
| Democratic | 7,374 | 80.79% | |||
| Republican | 1,378 | 15.10% | |||
| Others | 312 | 3.42% | |||
| Independent | 58 | 0.64% | |||
| Libertarian | 2 | 0.02% | |||
| Green | 2 | 0.02% | |||
| Total | 9,127 | 100% | |||
Statewide Elections
| Year | Republican | Democratic | Third parties |
|---|---|---|---|
| 2016 | 67.2% 3,082 | 29.7% 1,361 | 3.1% 144 |
| 2012 | 55.2% 2,275 | 42.9% 1,770 | 1.9% 77 |
| 2008 | 49.2% 2,234 | 48.7% 2,210 | 2.2% 99 |
| 2004 | 46.1% 2,269 | 53.0% 2,608 | 0.9% 42 |
| 2000 | 51.5% 2,303 | 46.7% 2,087 | 1.9% 83 |
| 1996 | 34.4% 1,229 | 52.8% 1,886 | 12.8% 455 |
| 1992 | 30.0% 1,259 | 53.0% 2,229 | 17.0% 716 |
| 1988 | 43.3% 1,614 | 56.4% 2,099 | 0.3% 11 |
| 1984 | 52.9% 2,020 | 46.6% 1,781 | 0.5% 19 |
| 1980 | 39.6% 1,463 | 58.8% 2,174 | 1.7% 61 |
| 1976 | 30.5% 938 | 68.8% 2,113 | 0.7% 20 |
| 1972 | 58.5% 1,919 | 41.0% 1,347 | 0.5% 16 |
| 1968 | 38.3% 1,277 | 41.9% 1,394 | 19.8% 660 |
| 1964 | 28.1% 1,009 | 71.7% 2,571 | 0.2% 7 |
| 1960 | 47.8% 1,888 | 52.3% 2,066 | 0.0% 0 |
| 1956 | 45.8% 1,889 | 53.8% 2,221 | 0.4% 15 |
| 1952 | 41.9% 1,737 | 57.9% 2,400 | 0.1% 5 |
| 1948 | 35.3% 1,276 | 63.2% 2,287 | 1.6% 56 |
| 1944 | 41.9% 1,581 | 57.9% 2,184 | 0.2% 8 |
| 1940 | 39.2% 1,636 | 60.5% 2,528 | 0.3% 12 |
| 1936 | 38.1% 1,725 | 61.7% 2,795 | 0.2% 10 |
| 1932 | 35.0% 1,576 | 64.6% 2,909 | 0.4% 20 |
| 1928 | 54.7% 2,223 | 45.1% 1,830 | 0.2% 8 |
| 1924 | 44.9% 1,723 | 54.6% 2,093 | 0.6% 21 |
| 1920 | 44.8% 1,997 | 54.7% 2,440 | 0.5% 22 |
| 1916 | 42.8% 1,360 | 56.5% 1,796 | 0.8% 24 |
| 1912 | 36.3% 1,002 | 53.6% 1,477 | 10.1% 278 |
| Year | Republican | Democratic | Third parties |
|---|---|---|---|
| 2015 | 46.65% 1,045 | 49.87% 1,117 | 3.48% 78 |
| 2011 | 22.61% 417 | 58.62% 1,081 | 18.76% 346 |
| 2007 | 33.09% 1,136 | 66.91% 2,297 | 0.00% 0 |
| 2003 | 42.56% 1,398 | 57.44% 1,887 | 0.00% 0 |
| 1999 | 15.89% 197 | 55.00% 682 | 29.11% 202 |
| 1995 | 41.41% 1,309 | 58.34% 1,844 | 0.25% 8 |
Communities
- Owingsville (county seat)
- Salt Lick
- Sharpsburg
- Bethel
See also
References
- 1 2 "State & County QuickFacts". United States Census Bureau. Retrieved March 5, 2014.
- ↑ "Find a County". National Association of Counties. Archived from the original on 2012-07-12. Retrieved 2011-06-07.
- ↑ "Bath County". Kyenc.org. Retrieved June 3, 2013.
- ↑ Hogan, Roseann Reinemuth (1992). Kentucky Ancestry: A Guide to Genealogical and Historical Research. Ancestry Publishing. p. 192. Retrieved 26 July 2013.
- ↑ Funkhouser, W.D., and W.S. Webb. "Archaeological Survey of Kentucky: Butler County". University of Kentucky Reports in Anthropology 2 (1932): 56-58.
- ↑ "2010 Census Gazetteer Files". United States Census Bureau. August 22, 2012. Archived from the original on August 12, 2014. Retrieved August 12, 2014.
- ↑ "Population and Housing Unit Estimates". Retrieved June 9, 2017.
- ↑ "U.S. Decennial Census". United States Census Bureau. Archived from the original on May 12, 2015. Retrieved August 12, 2014.
- ↑ "Historical Census Browser". University of Virginia Library. Retrieved August 12, 2014.
- ↑ "Population of Counties by Decennial Census: 1900 to 1990". United States Census Bureau. Retrieved August 12, 2014.
- ↑ "Census 2000 PHC-T-4. Ranking Tables for Counties: 1990 and 2000" (PDF). United States Census Bureau. Retrieved August 12, 2014.
- ↑ "American FactFinder". United States Census Bureau. Archived from the original on 2013-09-11. Retrieved 2008-01-31.
- ↑ "Archived copy" (PDF). Archived from the original (PDF) on 2014-11-26. Retrieved 2014-11-28.
- ↑ Leip, David. "Dave Leip's Atlas of U.S. Presidential Elections". uselectionatlas.org. Retrieved 2018-06-29.
External links
Municipalities and communities of Bath County, Kentucky, United States | ||
|---|---|---|
| Cities | | |
| Unincorporated communities | ||