Montgomery County, Kentucky
| Montgomery County, Kentucky | |
|---|---|
 Montgomery County courthouse in Mount Sterling | |
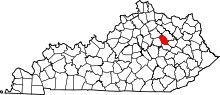 Location in the U.S. state of Kentucky | |
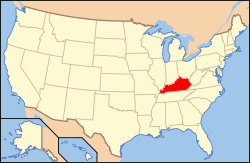 Kentucky's location in the U.S. | |
| Founded | 1796 |
| Named for | Richard Montgomery |
| Seat | Mount Sterling |
| Largest city | Mount Sterling |
| Area | |
| • Total | 199 sq mi (515 km2) |
| • Land | 197 sq mi (510 km2) |
| • Water | 1.5 sq mi (4 km2), 0.7% |
| Population | |
| • (2010) | 26,499 |
| • Density | 134/sq mi (52/km2) |
| Congressional district | 6th |
| Time zone | Eastern: UTC−5/−4 |
| Website |
montgomerycounty |
Montgomery County is a county located in the U.S. state of Kentucky. As of the 2010 census, the population was 26,499.[1] Its county seat is Mount Sterling.[2] With regard to the sale of alcohol, it is classified as a moist county—a county in which alcohol sales are prohibited (a dry county), but containing a "wet" city where package alcohol sales are allowed, in this case Mount Sterling.[3]
Montgomery County is part of the Mount Sterling, KY Micropolitan Statistical Area, which is also included in the Lexington-Fayette-Richmond-Frankfort, KY Combined Statistical Area.
History
In 1793 Shoe Boots (Tarsekayahke) led Cherokee and Shawnee warriors in a raid on Morgan's Station, in what was known as the last Indian raid in Kentucky. Some settlers were killed and two adolescent girls, including Clarinda Allington, were taken captive and the party returned to Cherokee territory. Believing he had saved Clarinda's life, Shoe Boots later married her, and they had three children together. He was a wealthy, successful leader. Several years later, Clarinda gained a visit back to her family in Kentucky with her children and decided to stay. They could not support her, but the state voted a 3-year pension for her.[4]
Montgomery County was established in 1796 from land given by Clark County. Montgomery was the 22nd Kentucky county in order of formation.[5]
Montgomery County was named in honor of Richard Montgomery, an American Revolutionary War Brigadier General killed in 1775 while attempting to capture Quebec City, Canada.[6] An alternative story holds that the County was named for Thomas Montgomery from Virginia, who served in the Revolutionary War. In 1793 Thomas Montgomery settled in Mt. Sterling. In 1805, Thomas Montgomery moved on to Gibson County, Indiana.
Geography
According to the U.S. Census Bureau, the county has a total area of 199 square miles (520 km2), of which 197 square miles (510 km2) is land and 1.5 square miles (3.9 km2) (0.7%) is water.[7]
Adjacent counties
- Bourbon County (northwest)
- Bath County (northeast)
- Menifee County (southeast)
- Powell County (south)
- Clark County (west)
Demographics
| Historical population | |||
|---|---|---|---|
| Census | Pop. | %± | |
| 1800 | 7,082 | — | |
| 1810 | 12,975 | 83.2% | |
| 1820 | 9,587 | −26.1% | |
| 1830 | 10,240 | 6.8% | |
| 1840 | 9,332 | −8.9% | |
| 1850 | 9,903 | 6.1% | |
| 1860 | 7,859 | −20.6% | |
| 1870 | 7,557 | −3.8% | |
| 1880 | 10,566 | 39.8% | |
| 1890 | 12,367 | 17.0% | |
| 1900 | 12,834 | 3.8% | |
| 1910 | 12,868 | 0.3% | |
| 1920 | 12,245 | −4.8% | |
| 1930 | 11,660 | −4.8% | |
| 1940 | 12,280 | 5.3% | |
| 1950 | 13,025 | 6.1% | |
| 1960 | 13,461 | 3.3% | |
| 1970 | 15,364 | 14.1% | |
| 1980 | 20,046 | 30.5% | |
| 1990 | 19,561 | −2.4% | |
| 2000 | 22,554 | 15.3% | |
| 2010 | 26,499 | 17.5% | |
| Est. 2016 | 27,771 | [8] | 4.8% |
| U.S. Decennial Census[9] 1790-1960[10] 1900-1990[11] 1990-2000[12] 2010-2013[1] | |||
As of the census[13] of 2000, there were 22,554 people, 8,902 households, and 6,436 families residing in the county. The population density was 114 per square mile (44/km2). There were 9,682 housing units at an average density of 49 per square mile (19/km2). The racial makeup of the county was 95.07% White, 3.48% Black or African American, 0.15% Native American, 0.11% Asian, 0.03% Pacific Islander, 0.35% from other races, and 0.82% from two or more races. 1.15% of the population were Hispanic or Latino of any race.
There were 8,902 households out of which 33.60% had children under the age of 18 living with them, 57.70% were married couples living together, 11.20% had a female householder with no husband present, and 27.70% were non-families. 23.90% of all households were made up of individuals and 10.50% had someone living alone who was 65 years of age or older. The average household size was 2.49 and the average family size was 2.93.
The age distribution was 24.90% under the age of 18, 8.70% from 18 to 24, 30.20% from 25 to 44, 23.40% from 45 to 64, and 12.90% who were 65 years of age or older. The median age was 36 years. For every 100 females, there were 94.60 males. For every 100 females age 18 and over, there were 91.00 males.
The median income for a household in the county was $31,746, and the median income for a family was $36,939. Males had a median income of $31,428 versus $20,941 for females. The per capita income for the county was $16,701. About 12.50% of families and 15.20% of the population were below the poverty line, including 18.10% of those under age 18 and 17.30% of those age 65 or over.
Politics
| Year | Republican | Democratic | Third parties |
|---|---|---|---|
| 2016 | 68.6% 7,856 | 27.6% 3,158 | 3.8% 438 |
| 2012 | 62.4% 6,398 | 36.1% 3,701 | 1.5% 149 |
| 2008 | 57.6% 5,947 | 41.0% 4,234 | 1.5% 150 |
| 2004 | 55.2% 5,647 | 44.1% 4,506 | 0.8% 77 |
| 2000 | 53.2% 4,534 | 45.0% 3,833 | 1.8% 152 |
| 1996 | 39.5% 2,681 | 49.6% 3,372 | 10.9% 743 |
| 1992 | 34.0% 2,590 | 48.4% 3,686 | 17.5% 1,335 |
| 1988 | 52.6% 3,435 | 47.2% 3,082 | 0.3% 20 |
| 1984 | 60.6% 3,864 | 39.1% 2,490 | 0.4% 23 |
| 1980 | 44.7% 2,869 | 52.8% 3,391 | 2.5% 158 |
| 1976 | 38.8% 2,032 | 60.0% 3,141 | 1.2% 61 |
| 1972 | 62.6% 2,868 | 36.2% 1,657 | 1.2% 54 |
| 1968 | 46.9% 2,113 | 31.2% 1,408 | 21.9% 987 |
| 1964 | 33.6% 1,540 | 66.3% 3,039 | 0.1% 4 |
| 1960 | 48.3% 2,451 | 51.8% 2,629 | 0.0% 0 |
| 1956 | 45.4% 2,220 | 54.3% 2,656 | 0.4% 19 |
| 1952 | 42.6% 1,981 | 57.1% 2,653 | 0.3% 14 |
| 1948 | 26.4% 1,083 | 66.5% 2,731 | 7.1% 292 |
| 1944 | 38.7% 1,481 | 61.1% 2,334 | 0.2% 8 |
| 1940 | 37.6% 1,671 | 62.1% 2,755 | 0.3% 13 |
| 1936 | 38.7% 1,649 | 60.8% 2,594 | 0.6% 24 |
| 1932 | 34.9% 1,515 | 64.8% 2,810 | 0.3% 13 |
| 1928 | 58.4% 2,742 | 41.2% 1,938 | 0.4% 19 |
| 1924 | 44.9% 1,956 | 53.9% 2,347 | 1.2% 51 |
| 1920 | 41.1% 2,163 | 58.4% 3,069 | 0.5% 28 |
| 1916 | 40.9% 1,195 | 58.3% 1,705 | 0.8% 23 |
| 1912 | 27.1% 758 | 57.8% 1,615 | 15.1% 421 |
Communities
- Camargo
- Jeffersonville
- Judy
- Levee
- Mount Sterling (county seat)
See also
References
- 1 2 "State & County QuickFacts". United States Census Bureau. Archived from the original on July 15, 2011. Retrieved March 6, 2014.
- ↑ "Find a County". National Association of Counties. Retrieved 2011-06-07.
- ↑ "Wet & Dry Counties in Kentucky" (PDF). Kentucky Office of Alcoholic Beverage Control. Archived from the original (PDF) on March 15, 2007. Retrieved March 21, 2007.
- ↑ Tiya Miles, Ties That Bind: The Story of an Afro-Cherokee Family in Slavery and Freedom, University of California Press, 2nd edition, 2015, pp. 19-21 Archived 2016-01-20 at the Wayback Machine.
- ↑ Collins, Lewis (1882). Collins' Historical Sketches of Kentucky: History of Kentucky, Volume 2. Collins & Company. p. 26.
- ↑ The Register of the Kentucky State Historical Society, Volume 1. Kentucky State Historical Society. 1903. p. 36.
- ↑ "2010 Census Gazetteer Files". United States Census Bureau. August 22, 2012. Archived from the original on August 12, 2014. Retrieved August 18, 2014.
- ↑ "Population and Housing Unit Estimates". Retrieved June 9, 2017.
- ↑ "U.S. Decennial Census". United States Census Bureau. Retrieved August 18, 2014.
- ↑ "Historical Census Browser". University of Virginia Library. Retrieved August 18, 2014.
- ↑ "Population of Counties by Decennial Census: 1900 to 1990". United States Census Bureau. Retrieved August 18, 2014.
- ↑ "Census 2000 PHC-T-4. Ranking Tables for Counties: 1990 and 2000" (PDF). United States Census Bureau. Retrieved August 18, 2014.
- ↑ "American FactFinder". United States Census Bureau. Retrieved 2008-01-31.
- ↑ Leip, David. "Dave Leip's Atlas of U.S. Presidential Elections". uselectionatlas.org. Retrieved 2018-07-05.
External links
Municipalities and communities of Montgomery County, Kentucky, United States | ||
|---|---|---|
| Cities | | |
| Unincorporated community | ||