Fleming County, Kentucky
| Fleming County, Kentucky | |
|---|---|
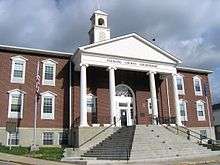 Fleming County courthouse in Flemingsburg | |
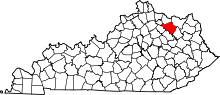 Location in the U.S. state of Kentucky | |
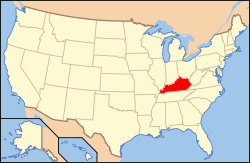 Kentucky's location in the U.S. | |
| Founded | 1798 |
| Named for | John Fleming (1735–1791), early settler of Kentucky |
| Seat | Flemingsburg |
| Largest city | Flemingsburg |
| Area | |
| • Total | 351 sq mi (909 km2) |
| • Land | 349 sq mi (904 km2) |
| • Water | 2.8 sq mi (7 km2), 0.8% |
| Population | |
| • (2010) | 14,348 |
| • Density | 41/sq mi (16/km2) |
| Congressional district | 6th |
| Time zone | Eastern: UTC−5/−4 |
| Website |
www |
Fleming County is a county located in the U.S. state of Kentucky. As of the 2010 census, the population was 14,348.[1] Its county seat is Flemingsburg.[2] The county was formed in 1798 and named for Colonel John Fleming, an Indian fighter and early settler.[3][4] It is a prohibition or dry county.
In 1998, the Kentucky General Assembly designated Fleming County as the Covered Bridge Capital of Kentucky.[5]
History
Fleming County was established in 1798 from land given by Mason County.[6] The first courthouse, possibly built of logs, was replaced in 1830 and again in 1952.[7]
Geography
According to the U.S. Census Bureau, the county has a total area of 351 square miles (910 km2), of which 349 square miles (900 km2) is land and 2.8 square miles (7.3 km2) (0.8%) is water.[8]
Adjacent counties
- Mason County (north)
- Lewis County (northeast)
- Rowan County (southeast)
- Bath County (south)
- Nicholas County (west)
- Robertson County (northwest)
Demographics
| Historical population | |||
|---|---|---|---|
| Census | Pop. | %± | |
| 1800 | 5,016 | — | |
| 1810 | 8,947 | 78.4% | |
| 1820 | 12,186 | 36.2% | |
| 1830 | 13,499 | 10.8% | |
| 1840 | 13,268 | −1.7% | |
| 1850 | 13,914 | 4.9% | |
| 1860 | 12,489 | −10.2% | |
| 1870 | 13,398 | 7.3% | |
| 1880 | 15,221 | 13.6% | |
| 1890 | 16,078 | 5.6% | |
| 1900 | 17,074 | 6.2% | |
| 1910 | 16,066 | −5.9% | |
| 1920 | 15,614 | −2.8% | |
| 1930 | 12,931 | −17.2% | |
| 1940 | 13,327 | 3.1% | |
| 1950 | 11,962 | −10.2% | |
| 1960 | 10,890 | −9.0% | |
| 1970 | 11,366 | 4.4% | |
| 1980 | 12,323 | 8.4% | |
| 1990 | 12,292 | −0.3% | |
| 2000 | 13,792 | 12.2% | |
| 2010 | 14,348 | 4.0% | |
| Est. 2016 | 14,507 | [9] | 1.1% |
| U.S. Decennial Census[10] 1790-1960[11] 1900-1990[12] 1990-2000[13] 2010-2013[1] | |||
As of the census[14] of 2000, there were 13,792 people, 5,367 households, and 3,966 families residing in the county. The population density was 39 people per square mile (15/km²). There were 6,120 housing units at an average density of 17 per square mile (7/km²). The racial makeup of the county was 97.33% White, 1.41% Black or African American, 0.14% Native American, 0.17% Asian, 0.28% from other races, and 0.67% from two or more races. 0.75% of the population were Hispanic or Latino of any race.
There were 5,367 households out of which 34.80% had children under the age of 18 living with them, 60.30% were married couples living together, 9.60% had a female householder with no husband present, and 26.10% were non-families. 23.30% of all households were made up of individuals and 11.00% had someone living alone who was 65 years of age or older. The average household size was 2.55 and the average family size was 2.99.
In the county, the population was spread out with 25.40% under the age of 18, 8.40% from 18 to 24, 29.00% from 25 to 44, 23.90% from 45 to 64, and 13.40% who were 65 years of age or older. The median age was 36 years. For every 100 females there were 96.00 males. For every 100 females age 18 and over, there were 93.20 males.
The median income for a household in the county was $27,990, and the median income for a family was $33,300. Males had a median income of $26,463 versus $19,895 for females. The per capita income for the county was $14,214. About 14.80% of families and 18.60% of the population were below the poverty line, including 24.90% of those under age 18 and 20.10% of those age 65 or over.
Politics
| Year | Republican | Democratic | Third parties |
|---|---|---|---|
| 2016 | 75.4% 4,722 | 21.5% 1,348 | 3.0% 190 |
| 2012 | 65.4% 3,780 | 33.1% 1,911 | 1.6% 91 |
| 2008 | 58.9% 3,432 | 39.1% 2,279 | 2.1% 121 |
| 2004 | 60.4% 3,749 | 38.8% 2,406 | 0.8% 48 |
| 2000 | 63.4% 3,282 | 35.0% 1,813 | 1.6% 84 |
| 1996 | 48.6% 2,313 | 40.2% 1,913 | 11.3% 538 |
| 1992 | 39.8% 2,045 | 44.0% 2,257 | 16.2% 833 |
| 1988 | 53.3% 2,409 | 46.1% 2,086 | 0.6% 27 |
| 1984 | 63.3% 2,824 | 36.2% 1,616 | 0.4% 19 |
| 1980 | 50.7% 2,189 | 47.5% 2,051 | 1.7% 75 |
| 1976 | 41.4% 1,647 | 58.2% 2,317 | 0.5% 19 |
| 1972 | 62.4% 2,484 | 36.5% 1,455 | 1.1% 43 |
| 1968 | 53.3% 2,220 | 33.7% 1,406 | 13.0% 541 |
| 1964 | 38.3% 1,668 | 61.5% 2,678 | 0.1% 6 |
| 1960 | 55.6% 2,777 | 44.4% 2,216 | 0.0% 0 |
| 1956 | 52.0% 2,744 | 47.7% 2,519 | 0.3% 17 |
| 1952 | 51.3% 2,592 | 48.4% 2,446 | 0.2% 12 |
| 1948 | 42.7% 2,088 | 55.6% 2,722 | 1.7% 84 |
| 1944 | 50.4% 2,666 | 49.4% 2,612 | 0.3% 14 |
| 1940 | 48.7% 2,855 | 51.1% 2,999 | 0.2% 14 |
| 1936 | 48.7% 2,749 | 51.0% 2,879 | 0.4% 21 |
| 1932 | 43.1% 2,638 | 56.2% 3,442 | 0.7% 44 |
| 1928 | 64.5% 3,798 | 35.4% 2,086 | 0.1% 4 |
| 1924 | 49.4% 2,572 | 49.7% 2,590 | 0.9% 47 |
| 1920 | 45.7% 2,960 | 53.9% 3,488 | 0.4% 26 |
| 1916 | 44.6% 1,836 | 54.4% 2,240 | 1.0% 41 |
| 1912 | 36.8% 1,400 | 50.3% 1,915 | 12.9% 492 |
Communities
Cities
Census-designated place
Unincorporated communities
- Bald Hill
- Beechburg
- Blue Bank
- Colfax
- Concord
- Cowan
- Craintown
- Dalesburg
- Fairview
- Foxport
- Fox Valley
- Goddard
- Grange City
- Hillsboro
- Hilltop
- Johnson Junction
- Mount Carmel
- Muses Mills
- Nepton
- Pleasureville
- Plummers Landing
- Poplar Grove
- Poplar Plains
- Ringos Mills
- Sherburne
- Tilton
- Wallingford
Notable residents
- Herman Chittison, jazz pianist
- Edward Alvin Clary, US Navy Medal Of Honor Recipient, 23 March 1910
- Claiborne Fox Jackson, Pro-Confederate Missouri governor during the early part of the Civil War
- Alvin Saunders, United States senator from Nebraska
- Franklin Sousley, Iwo Jima flagraiser
See also
References
- 1 2 "State & County QuickFacts". United States Census Bureau. Archived from the original on July 10, 2011. Retrieved March 6, 2014.
- ↑ "Find a County". National Association of Counties. Archived from the original on 2011-05-31. Retrieved 2011-06-07.
- ↑ Rennick, Robert M. (1987). Kentucky Place Names. University Press of Kentucky. p. 103. Retrieved 2013-04-28.
- ↑ Gannett, Henry (1905). The Origin of Certain Place Names in the United States. Govt. Print. Off. p. 127.
- ↑ Kentucky State Symbols Archived January 28, 2011, at the Wayback Machine.
- ↑ Collins, Lewis (1882). Collins' Historical Sketches of Kentucky: History of Kentucky, Volume 2. Collins & Company. p. 26.
- ↑ Hogan, Roseann Reinemuth (1992). Kentucky Ancestry: A Guide to Genealogical and Historical Research. Ancestry Publishing. p. 230. Retrieved 26 July 2013.
- ↑ "2010 Census Gazetteer Files". United States Census Bureau. August 22, 2012. Archived from the original on August 12, 2014. Retrieved August 14, 2014.
- ↑ "Population and Housing Unit Estimates". Retrieved June 9, 2017.
- ↑ "U.S. Decennial Census". United States Census Bureau. Archived from the original on May 12, 2015. Retrieved August 14, 2014.
- ↑ "Historical Census Browser". University of Virginia Library. Retrieved August 14, 2014.
- ↑ "Population of Counties by Decennial Census: 1900 to 1990". United States Census Bureau. Retrieved August 14, 2014.
- ↑ "Census 2000 PHC-T-4. Ranking Tables for Counties: 1990 and 2000" (PDF). United States Census Bureau. Retrieved August 14, 2014.
- ↑ "American FactFinder". United States Census Bureau. Archived from the original on 2013-09-11. Retrieved 2008-01-31.
- ↑ Leip, David. "Dave Leip's Atlas of U.S. Presidential Elections". uselectionatlas.org. Retrieved 10 April 2018.
External links
Municipalities and communities of Fleming County, Kentucky, United States | ||
|---|---|---|
| Cities | | |
| CDP | ||
| Other unincorporated communities | ||