Trimble County, Kentucky
| Trimble County, Kentucky | |
|---|---|
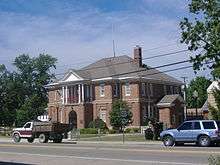 Trimble County Courthouse in Bedford | |
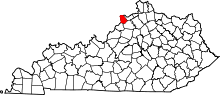 Location in the U.S. state of Kentucky | |
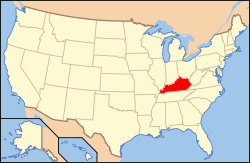 Kentucky's location in the U.S. | |
| Founded | February 9, 1837 |
| Seat | Bedford |
| Largest city | Bedford |
| Area | |
| • Total | 156 sq mi (404 km2) |
| • Land | 152 sq mi (394 km2) |
| • Water | 4.6 sq mi (12 km2), 2.9% |
| Population | |
| • (2010) | 8,809 |
| • Density | 58/sq mi (22/km2) |
| Congressional district | 4th |
| Time zone | Eastern: UTC−5/−4 |
| Website |
www |
Trimble County is a county located in the U.S. state of Kentucky. As of the 2010 census, the population was 8,809.[1] Its county seat is Bedford.[2] The county was founded in 1837 and is named for Robert Trimble.[3][4] Trimble is no longer a prohibition or dry county.
Trimble County is part of the Louisville/Jefferson County, KY–IN Metropolitan Statistical Area.
Geography
According to the U.S. Census Bureau, the county has a total area of 156 square miles (400 km2), of which 152 square miles (390 km2) is land and 4.6 square miles (12 km2) (2.9%) is water.[5] It is the fifth-smallest county in Kentucky by land area and fourth-smallest by total area. The county's western border with Indiana is formed by the Ohio River.
Adjacent counties
- Jefferson County, Indiana (northwest)
- Carroll County (east)
- Henry County (southeast)
- Oldham County (southwest)
- Clark County, Indiana (west)
Manufacturing
LG&E and KU's newest power plant, the Trimble County Generating Station, provides power to about 1 million Kentucky residents.[6] and is located on 2,200 acres situated along the Ohio River, 50 miles northeast of Louisville.[7] It has been recognized as one of the most environmentally friendly coal fired plants in the country.[8] Controversy with the plant include, the desire of the plant to dump its coal ash on its site.[6] The EPA has said the plant should consider shipping the waste to Gallatin County, Kentucky to be placed in an underground limestone mine that already holds a permit to accept coal combustion waste.[6]
Demographics
| Historical population | |||
|---|---|---|---|
| Census | Pop. | %± | |
| 1840 | 4,480 | — | |
| 1850 | 5,963 | 33.1% | |
| 1860 | 5,880 | −1.4% | |
| 1870 | 5,577 | −5.2% | |
| 1880 | 7,171 | 28.6% | |
| 1890 | 7,140 | −0.4% | |
| 1900 | 7,272 | 1.8% | |
| 1910 | 6,512 | −10.5% | |
| 1920 | 6,011 | −7.7% | |
| 1930 | 5,348 | −11.0% | |
| 1940 | 5,601 | 4.7% | |
| 1950 | 5,148 | −8.1% | |
| 1960 | 5,102 | −0.9% | |
| 1970 | 5,349 | 4.8% | |
| 1980 | 6,253 | 16.9% | |
| 1990 | 6,090 | −2.6% | |
| 2000 | 8,125 | 33.4% | |
| 2010 | 8,809 | 8.4% | |
| Est. 2016 | 8,620 | [9] | −2.1% |
| U.S. Decennial Census[10] 1790–1960[11] 1900–1990[12] 1990–2000[13] 2010–2013[1] | |||
According to the census of 2010, there were 8,809 people and 3,512 households from 2009 to 2013.[14] The population density was 55 per square mile (21/km2). There were 3,437 housing units at an average density of 23 per square mile (8.9/km2). The racial makeup of the county was 96.2% White, 1.5% Black or African American, 0.6% Native American, 0.5% Asian, 0.68% from other races, and 1.1% from two or more races. 3.5% of the population were Hispanic or Latino.[14]
There were 3,137 households out of which 35.40% had children under the age of 18 living with them, 60.60% were married couples living together, 8.50% had a female householder with no husband present, and 26.80% were non-families. 22.00% of all households were made up of individuals and 9.10% had someone living alone who was 65 years of age or older. The average household size was 2.57 and the average family size was 3.00.
In the county, the population was spread out with 26.40% under the age of 18, 7.70% from 18 to 24, 30.90% from 25 to 44, 23.60% from 45 to 64, and 11.40% who were 65 years of age or older. The median age was 36 years. For every 100 females, there were 96.80 males. For every 100 females age 18 and over, there were 94.80 males.
The median income for a household in the county was $36,192, and the median income for a family was $41,925. Males had a median income of $30,500 versus $21,656 for females. The per capita income for the county was $16,354. About 10.00% of families and 13.60% of the population were below the poverty line, including 14.70% of those under age 18 and 16.80% of those age 65 or over.
Communities
- Barebone (ghost town)
- Bedford (county seat)
- Locust
- Milton
- Wise's Landing
Politics
| Year | Republican | Democratic | Third parties |
|---|---|---|---|
| 2016 | 73.0% 2,771 | 23.1% 879 | 3.9% 148 |
| 2012 | 60.2% 2,133 | 38.2% 1,355 | 1.6% 55 |
| 2008 | 58.7% 2,239 | 38.9% 1,484 | 2.3% 89 |
| 2004 | 61.5% 2,332 | 37.7% 1,428 | 0.8% 30 |
| 2000 | 59.6% 1,837 | 38.3% 1,181 | 2.0% 63 |
| 1996 | 38.9% 999 | 48.5% 1,245 | 12.6% 324 |
| 1992 | 30.0% 789 | 53.7% 1,413 | 16.3% 429 |
| 1988 | 44.4% 1,083 | 55.0% 1,342 | 0.6% 15 |
| 1984 | 55.8% 1,389 | 43.7% 1,088 | 0.5% 13 |
| 1980 | 34.5% 824 | 61.8% 1,478 | 3.8% 90 |
| 1976 | 24.5% 517 | 74.2% 1,568 | 1.3% 28 |
| 1972 | 54.6% 935 | 44.2% 757 | 1.2% 20 |
| 1968 | 26.0% 511 | 53.1% 1,045 | 20.9% 411 |
| 1964 | 13.4% 292 | 86.4% 1,881 | 0.2% 5 |
| 1960 | 31.9% 743 | 68.1% 1,587 | 0.0% 0 |
| 1956 | 21.9% 506 | 77.6% 1,792 | 0.5% 12 |
| 1952 | 16.5% 370 | 82.8% 1,855 | 0.7% 15 |
| 1948 | 9.7% 194 | 87.5% 1,746 | 2.8% 56 |
| 1944 | 12.0% 264 | 86.7% 1,916 | 1.4% 30 |
| 1940 | 11.2% 242 | 88.6% 1,909 | 0.2% 4 |
| 1936 | 13.9% 271 | 85.2% 1,659 | 0.9% 18 |
| 1932 | 10.9% 257 | 88.5% 2,083 | 0.6% 14 |
| 1928 | 30.2% 573 | 69.5% 1,317 | 0.3% 5 |
| 1924 | 16.6% 335 | 83.1% 1,676 | 0.3% 6 |
| 1920 | 14.8% 361 | 84.5% 2,057 | 0.7% 16 |
| 1916 | 16.2% 259 | 82.2% 1,319 | 1.6% 26 |
| 1912 | 11.0% 163 | 79.6% 1,183 | 9.5% 141 |
See also
References
- 1 2 "State & County QuickFacts". United States Census Bureau. Retrieved March 6, 2014.
- ↑ "Find a County". National Association of Counties. Retrieved 2011-06-07.
- ↑ "Trimble County". The Kentucky Encyclopedia. 2000. Retrieved August 23, 2014.
- ↑ The Register of the Kentucky State Historical Society, Volume 1. Kentucky State Historical Society. 1903. p. 37.
- ↑ "2010 Census Gazetteer Files". United States Census Bureau. August 22, 2012. Archived from the original on August 12, 2014. Retrieved August 20, 2014.
- 1 2 3 "LG&E coal ash landfill hits another wall". The Courier-Journal. Retrieved 2018-07-06.
- ↑ "Trimble County Generating Station | LG&E and KU". lge-ku.com. Retrieved 2015-09-24.
- ↑ "A Tour of LG&E & KU's Trimble County Generating Station". Retrieved 2015-09-24.
- ↑ "Population and Housing Unit Estimates". Retrieved June 9, 2017.
- ↑ "U.S. Decennial Census". United States Census Bureau. Retrieved August 20, 2014.
- ↑ "Historical Census Browser". University of Virginia Library. Retrieved August 20, 2014.
- ↑ "Population of Counties by Decennial Census: 1900 to 1990". United States Census Bureau. Retrieved August 20, 2014.
- ↑ "Census 2000 PHC-T-4. Ranking Tables for Counties: 1990 and 2000" (PDF). United States Census Bureau. Retrieved August 20, 2014.
- 1 2 http://quickfacts.census.gov/qfd/states/21/21223.html
- ↑ Leip, David. "Dave Leip's Atlas of U.S. Presidential Elections". uselectionatlas.org. Retrieved 2018-07-06.
External links
Municipalities and communities of Trimble County, Kentucky, United States | ||
|---|---|---|
| Cities | | |
| Unincorporated communities | ||
| Ghost town | ||