Butler County, Kentucky
| Butler County, Kentucky | |
|---|---|
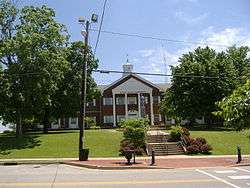 Butler County Courthouse in Morgantown | |
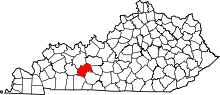 Location in the U.S. state of Kentucky | |
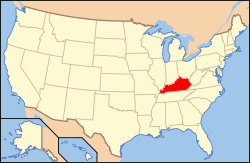 Kentucky's location in the U.S. | |
| Founded | 1810 |
| Named for | Richard Butler |
| Seat | Morgantown |
| Largest city | Morgantown |
| Area | |
| • Total | 431 sq mi (1,116 km2) |
| • Land | 426 sq mi (1,103 km2) |
| • Water | 5.4 sq mi (14 km2), 1.2% |
| Population | |
| • (2000) | 13,010 |
| • Density | 30/sq mi (10/km2) |
| Congressional district | 2nd |
| Time zone | Central: UTC−6/−5 |
| Website |
www |
Butler County is a county located in the US state of Kentucky. As of the 2010 census, the population was 12,690.[1] Its county seat is Morgantown.[2] The county was formed in 1810, becoming Kentucky's 53rd county.[3]
Butler County is included in the Bowling Green, KY Metropolitan Statistical Area.
History
Numerous archaeological sites are located along the Green River in Butler County. A 1932 survey found nine sites, many of which were a group of shell mounds, including the Carlston Annis and DeWeese Shell Mounds.[4]
The area now known as Butler County was first settled by the families of Richard C. Dellium and James Forgy, who founded a town called Berry's Lick. The first industry was salt-making.[3]
On January 18, 1810, the Kentucky General Assembly created Butler County from portions of Logan and Ohio counties. The new county was named for Major General Richard Butler, who died at the Battle of the Wabash in 1791.[3]
Butler County has one of only two Civil War monuments in Kentucky that honor the soldiers of both sides. The Confederate-Union Veterans' Monument in Morgantown, a zinc monument, was dedicated in 1907 on the Butler County Courthouse lawn.
Geography
According to the U.S. Census Bureau, the county has a total area of 431 square miles (1,120 km2), of which 426 square miles (1,100 km2) is land and 5.4 square miles (14 km2) (1.2%) is water.[5] It is part of the Western Coal Fields region of Kentucky.
Adjacent counties
- Ohio County (northwest)
- Grayson County (northeast)
- Edmonson County (east)
- Warren County (southeast)
- Logan County (south)
- Muhlenberg County (west)
Demographics
| Historical population | |||
|---|---|---|---|
| Census | Pop. | %± | |
| 1820 | 3,083 | — | |
| 1830 | 3,058 | −0.8% | |
| 1840 | 3,898 | 27.5% | |
| 1850 | 5,755 | 47.6% | |
| 1860 | 7,927 | 37.7% | |
| 1870 | 9,404 | 18.6% | |
| 1880 | 12,181 | 29.5% | |
| 1890 | 13,956 | 14.6% | |
| 1900 | 15,896 | 13.9% | |
| 1910 | 15,805 | −0.6% | |
| 1920 | 15,197 | −3.8% | |
| 1930 | 12,620 | −17.0% | |
| 1940 | 14,371 | 13.9% | |
| 1950 | 11,309 | −21.3% | |
| 1960 | 9,586 | −15.2% | |
| 1970 | 9,723 | 1.4% | |
| 1980 | 11,064 | 13.8% | |
| 1990 | 11,245 | 1.6% | |
| 2000 | 13,010 | 15.7% | |
| 2010 | 12,690 | −2.5% | |
| Est. 2016 | 12,845 | [6] | 1.2% |
| U.S. Decennial Census[7] 1790-1960[8] 1900-1990[9] 1990-2000[10] 2010-2013[1] | |||
As of the census[11] of 2000, there were 13,010 people, 5,059 households, and 3,708 families residing in the county. The population density was 30 per square mile (12/km2). There were 5,815 housing units at an average density of 14 per square mile (5.4/km2). The racial makeup of the county was 97.88% White, 0.52% Black or African American, 0.22% Native American, 0.17% Asian, 0.60% from other races, and 0.61% from two or more races. 1.04% of the population were Hispanic or Latino of any race.
There were 5,059 households out of which 34.40% had children under the age of 18 living with them, 60.30% were married couples living together, 9.30% had a female householder with no husband present, and 26.70% were non-families. 23.70% of all households were made up of individuals and 10.30% had someone living alone who was 65 years of age or older. The average household size was 2.52 and the average family size was 2.98.
In the county, the population was spread out with 25.30% under the age of 18, 9.50% from 18 to 24, 29.20% from 25 to 44, 23.20% from 45 to 64, and 12.80% who were 65 years of age or older. The median age was 36 years. For every 100 females there were 99.00 males. For every 100 females age 18 and over, there were 96.20 males.
The median income for a household in the county was $29,405, and the median income for a family was $35,317. Males had a median income of $26,449 versus $19,894 for females. The per capita income for the county was $14,617. About 13.10% of families and 16.00% of the population were below the poverty line, including 18.50% of those under age 18 and 22.50% of those age 65 or over.
Communities
- Morgantown (county seat)
- Rochester
- Woodbury
Politics
Like the central Pennyroyal Plateau, but unlike the Jackson Purchase or Barren and Simpson Counties, Butler County was strongly pro-Union during the Civil War due to its broken, sandy terrain unfavourable for plantation agriculture,[12] although its actual level of Union volunteering was lower than more easterly Pennyroyal counties.[13] Consequently, Butler County has remained rock-ribbed Republican thought the post-Civil War era: the last Democrat to carry the county was George B. McClellan in 1864, and the only Democrat to win forty percent of the county’s vote since at least 1896 has been Franklin D. Roosevelt in 1932.
| Year | Republican | Democratic | Third parties |
|---|---|---|---|
| 2016 | 79.4% 4,428 | 17.0% 947 | 3.6% 201 |
| 2012 | 73.4% 3,716 | 25.6% 1,293 | 1.0% 51 |
| 2008 | 69.6% 3,696 | 29.3% 1,555 | 1.1% 56 |
| 2004 | 73.7% 4,109 | 25.7% 1,436 | 0.6% 33 |
| 2000 | 72.9% 3,654 | 25.9% 1,299 | 1.1% 57 |
| 1996 | 61.0% 2,531 | 30.4% 1,260 | 8.6% 358 |
| 1992 | 56.8% 2,729 | 30.6% 1,468 | 12.7% 609 |
| 1988 | 72.2% 3,278 | 27.4% 1,245 | 0.4% 16 |
| 1984 | 74.5% 3,121 | 25.2% 1,055 | 0.4% 15 |
| 1980 | 70.3% 3,129 | 28.6% 1,274 | 1.1% 47 |
| 1976 | 59.4% 2,363 | 39.9% 1,588 | 0.8% 30 |
| 1972 | 77.0% 2,941 | 21.9% 835 | 1.1% 42 |
| 1968 | 66.5% 2,637 | 17.4% 691 | 16.1% 639 |
| 1964 | 60.9% 2,429 | 39.0% 1,555 | 0.2% 8 |
| 1960 | 78.7% 3,656 | 21.3% 992 | 0.0% 0 |
| 1956 | 73.2% 3,303 | 26.6% 1,202 | 0.2% 8 |
| 1952 | 71.9% 2,996 | 27.8% 1,157 | 0.3% 12 |
| 1948 | 67.1% 2,494 | 29.7% 1,105 | 3.2% 118 |
| 1944 | 74.3% 3,354 | 25.5% 1,153 | 0.2% 7 |
| 1940 | 68.4% 3,163 | 31.5% 1,455 | 0.1% 6 |
| 1936 | 67.6% 2,594 | 32.3% 1,237 | 0.1% 4 |
| 1932 | 59.7% 2,586 | 40.1% 1,736 | 0.2% 9 |
| 1928 | 85.1% 3,942 | 14.8% 684 | 0.2% 7 |
| 1924 | 68.2% 2,644 | 30.4% 1,177 | 1.5% 57 |
| 1920 | 75.0% 4,097 | 24.8% 1,356 | 0.2% 13 |
| 1916 | 67.3% 2,456 | 31.8% 1,158 | 0.9% 33 |
| 1912 | 35.8% 1,070 | 29.4% 879 | 34.8% 1,041 |
Transportation
For much of its history, Butler County's main line of transportation was the Green River. As railroads became more important economically, the county compensated by building a series of roads to major trade centers such as U.S. 231 connecting Beaver Dam with Owensboro. Green River was eventually closed to traffic after Woodbury's Lock and Dam Number 4 washed out in 1965 and Rochester's Lock and Dam Number 3 was abandoned by the United States Army Corps of Engineers in 1980. Completion of the William H. Natcher Parkway linked the area to the national interstate system in 1970.[3]
Media
Radio stations
Newspaper
- Butler County Banner-Republican - published Wednesdays
Sites and events of interest
Sites include:
- Charles Black City Park - Helm Lane off Kentucky Route 70, Morgantown. It offers baseball and soccer fields, basketball and tennis courts; access free of charge. It is also the home to the Morgantown City Pool, which has a minimal charge for use.
- Cedar Ridge Speedway, two miles west of Morgantown along KY 70, is a venue for local racing leagues.
- Green River Museum, Woodbury
- The Corner Market in Roundhill, Junction of State routes 70 and 185 on the Butler-Edmonson County line.
- Big Reedy Christian Camp, D Simpson Road off KY 185, Reedyville.
Events include:
- Green River Catfish Festival (annual event) - Charles Black City Park and various locations; late June/early July Features a carnival, various contests, concerts, and tournaments. A fireworks display on July 4 is also included.
Notable people
- Claude C. Bloch (b. 1878 in Woodbury, d. 1967) – Admiral who commanded the local Naval District at Pearl Harbor at the time of the Japanese attack during World War II.
- Keith Butler - baseball pitcher, St. Louis Cardinals organization. (from Morgantown).[15]
- Thomas Hines – Confederate spy during the Civil War, later a chief justice of the Kentucky Court of Appeals
- Don J. Jenkins – Vietnam War soldier and Medal of Honor recipient (born in Quality)
- John M. Moore – bishop of the Methodist Episcopal Church, South (born in Morgantown)
- William S. Taylor – Governor of Kentucky from 1899 to 1900 (born near Morgantown)
- Pendleton Vandiver – fiddler and uncle of bluegrass musician Bill Monroe, who immortalized him in the song "Uncle Pen" and in the Country Boy music video for Ricky Skaggs
- Maurice Thatcher - Assistant Attorney General of Kentucky, Governor of Panama, and U.S. Representative.[16]
See also
References
- 1 2 "State & County QuickFacts". United States Census Bureau. Retrieved March 5, 2014.
- ↑ "Find a County". National Association of Counties. Archived from the original on May 31, 2011. Retrieved 2011-06-07.
- 1 2 3 4 Kleber, John E., ed. (1992). "Butler County". The Kentucky Encyclopedia. Associate editors: Thomas D. Clark, Lowell H. Harrison, and James C. Klotter. Lexington, Kentucky: The University Press of Kentucky. ISBN 0-8131-1772-0.
- ↑ Funkhouser, W.D., and W.S. Webb. "Archaeological Survey of Kentucky: Butler County". University of Kentucky Reports in Anthropology 2 (1932): 56-58.
- ↑ "2010 Census Gazetteer Files". United States Census Bureau. August 22, 2012. Archived from the original on August 12, 2014. Retrieved August 12, 2014.
- ↑ "Population and Housing Unit Estimates". Retrieved June 9, 2017.
- ↑ "U.S. Decennial Census". United States Census Bureau. Archived from the original on May 12, 2015. Retrieved August 12, 2014.
- ↑ "Historical Census Browser". University of Virginia Library. Retrieved August 12, 2014.
- ↑ "Population of Counties by Decennial Census: 1900 to 1990". United States Census Bureau. Retrieved August 12, 2014.
- ↑ "Census 2000 PHC-T-4. Ranking Tables for Counties: 1990 and 2000" (PDF). United States Census Bureau. Retrieved August 12, 2014.
- ↑ "American FactFinder". United States Census Bureau. Archived from the original on September 11, 2013. Retrieved 2008-01-31.
- ↑ Connelly, Thomas Lawrence; Army of the Heartland: The Army of Tennessee, 1861-1862, p. 69 ISBN 080712737X
- ↑ Copeland, James E.; ‘Where Were the Kentucky Unionists and Secessionists’; The Register of the Kentucky Historical Society, volume 71, no. 4 (October, 1973), pp. 344-363
- ↑ Leip, David. "Dave Leip's Atlas of U.S. Presidential Elections". uselectionatlas.org. Retrieved 2018-06-29.
- ↑ "Wabash Valley College roster". National Junior College Athletic Association. 2013. Archived from the original on December 3, 2013. Retrieved June 7, 2013.
- ↑ Kentucky Historical Society, Historical Hwy Marker program
External links

Municipalities and communities of Butler County, Kentucky, United States | ||
|---|---|---|
| Cities | | |
| Unincorporated communities | ||
| Footnotes | ‡This populated place also has portions in an adjacent county or counties | |
| Principal city | _Metro.png) | |
|---|---|---|
| Other municipalities | ||
| Counties | ||