Allen County, Kentucky
| Allen County, Kentucky | |
|---|---|
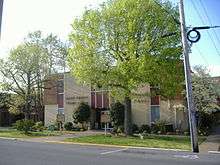 Allen County Courthouse in Scottsville | |
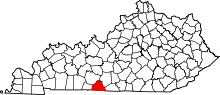 Location in the U.S. state of Kentucky | |
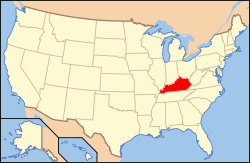 Kentucky's location in the U.S. | |
| Founded | 1815 |
| Named for | John Allen |
| Seat | Scottsville |
| Largest city | Scottsville |
| Area | |
| • Total | 352 sq mi (912 km2) |
| • Land | 344 sq mi (891 km2) |
| • Water | 7.5 sq mi (19 km2), 2.1% |
| Population | |
| • (2010) | 19,956 |
| • Density | 58/sq mi (22/km2) |
| Congressional district | 1st |
| Time zone | Central: UTC−6/−5 |
| Website |
www |
Allen County is a county located in the U.S. state of Kentucky. As of the 2010 census, the population was 19,956.[1] Its county seat is Scottsville.[2] The county is named for Colonel John Allen, a state senator and soldier who was killed leading the 1st Regiment of Kentucky Rifleman at the Battle of Frenchtown, Michigan during the War of 1812.[3] Allen County is a prohibition or completely dry county. It was formed in 1815 from parts of Barren and Warren counties.
Allen County is included in the Bowling Green, KY Metropolitan Statistical Area.
History
Allen County was established in 1815 from land given by Barren and Warren counties. A courthouse fire in 1902 resulted in the loss of some county records.[4]
Geography
According to the U.S. Census Bureau, the county has a total area of 352 square miles (910 km2), of which 344 square miles (890 km2) is land and 7.5 square miles (19 km2) (2.1%) is water.[5]
Adjacent counties
- Warren County northwest
- Barren County northeast
- Monroe County east
- Macon County, Tennessee southeast
- Sumner County, Tennessee southwest
- Simpson County west
Demographics
| Historical population | |||
|---|---|---|---|
| Census | Pop. | %± | |
| 1820 | 5,327 | — | |
| 1830 | 6,485 | 21.7% | |
| 1840 | 7,329 | 13.0% | |
| 1850 | 8,742 | 19.3% | |
| 1860 | 9,187 | 5.1% | |
| 1870 | 10,296 | 12.1% | |
| 1880 | 12,089 | 17.4% | |
| 1890 | 13,692 | 13.3% | |
| 1900 | 14,657 | 7.0% | |
| 1910 | 14,882 | 1.5% | |
| 1920 | 16,761 | 12.6% | |
| 1930 | 15,180 | −9.4% | |
| 1940 | 15,496 | 2.1% | |
| 1950 | 13,787 | −11.0% | |
| 1960 | 12,269 | −11.0% | |
| 1970 | 12,598 | 2.7% | |
| 1980 | 14,128 | 12.1% | |
| 1990 | 14,628 | 3.5% | |
| 2000 | 17,800 | 21.7% | |
| 2010 | 19,956 | 12.1% | |
| Est. 2016 | 20,631 | [6] | 3.4% |
| U.S. Decennial Census[7] 1790-1960[8] 1900-1990[9] 1990-2000[10] 2010-2013[1] | |||
As of the census[11] of 2000, there were 17,800 people, 6,910 households, and 5,113 families residing in the county. The population density was 51 per square mile (20/km2). There were 8,057 housing units at an average density of 23 per square mile (8.9/km2). The racial makeup of the county was 97.62% White, 1.07% Black or African American, 0.16% Native American, 0.12% Asian, 0.01% Pacific Islander, 0.36% from other races, and 0.66% from two or more races. 0.83% of the population were Hispanic or Latino of any race.
There were 6,910 households out of which 34.10% had children under the age of 18 living with them, 60.60% were married couples living together, 9.80% had a female householder with no husband present, and 26.00% were non-families. 23.10% of all households were made up of individuals and 10.40% had someone living alone who was 65 years of age or older. The average household size was 2.55 and the average family size was 2.99.
In the county, the population was spread out with 25.80% under the age of 18, 8.90% from 18 to 24, 28.50% from 25 to 44, 23.10% from 45 to 64, and 13.70% who were 65 years of age or older. The median age was 36 years. For every 100 females there were 95.90 males. For every 100 females age 18 and over, there were 93.30 males.
The median income for a household in the county was $31,238, and the median income for a family was $36,815. Males had a median income of $27,587 versus $22,659 for females. The per capita income for the county was $14,506. About 13.20% of families and 17.30% of the population were below the poverty line, including 23.40% of those under age 18 and 20.40% of those age 65 or over.
Politics
Allen County, like most of Kentucky, is increasingly solidly Republican, although it was like those counties to its east in Appalachia never a part of the "Solid South". The last Democrat to carry the county in a Presidential election was Woodrow Wilson in 1912, although a number of other elections have given Democrat majorities as recently as the 1999 gubernatorial election.[12]
Voter Registration
| Allen County Voter Registration & Party Enrollment as of November 17, 2015[13] | |||||
|---|---|---|---|---|---|
| Political Party | Total Voters | Percentage | |||
| Republican | 8,336 | 59.20% | |||
| Democratic | 4,799 | 34.08% | |||
| Others | 720 | 5.11% | |||
| Independent | 205 | 1.46% | |||
| Libertarian | 13 | 0.09% | |||
| Green | 6 | 0.04% | |||
| Total | 14,081 | 100% | |||
Statewide Elections
| Year | Republican | Democratic | Third parties |
|---|---|---|---|
| 2016 | 79.9% 6,466 | 16.7% 1,349 | 3.5% 281 |
| 2012 | 73.0% 5,184 | 25.5% 1,808 | 1.5% 108 |
| 2008 | 71.2% 5,258 | 27.4% 2,024 | 1.5% 108 |
| 2004 | 72.6% 5,202 | 26.9% 1,923 | 0.5% 38 |
| 2000 | 68.7% 4,415 | 30.3% 1,950 | 1.0% 64 |
| 1996 | 58.0% 3,032 | 34.1% 1,781 | 8.0% 417 |
| 1992 | 50.7% 2,747 | 37.7% 2,040 | 11.6% 628 |
| 1988 | 67.9% 3,342 | 32.0% 1,573 | 0.2% 8 |
| 1984 | 69.0% 3,427 | 30.6% 1,521 | 0.3% 16 |
| 1980 | 60.4% 3,186 | 38.1% 2,010 | 1.6% 82 |
| 1976 | 52.5% 2,508 | 46.7% 2,231 | 0.8% 39 |
| 1972 | 69.8% 3,025 | 29.1% 1,259 | 1.1% 48 |
| 1968 | 61.6% 2,952 | 19.4% 927 | 19.0% 911 |
| 1964 | 53.2% 2,309 | 46.6% 2,023 | 0.2% 10 |
| 1960 | 67.2% 3,410 | 32.8% 1,663 | 0.0% 0 |
| 1956 | 61.6% 3,200 | 38.0% 1,975 | 0.4% 18 |
| 1952 | 62.5% 2,946 | 37.1% 1,750 | 0.5% 21 |
| 1948 | 55.8% 2,280 | 39.3% 1,605 | 4.9% 200 |
| 1944 | 63.9% 3,120 | 35.7% 1,742 | 0.5% 24 |
| 1940 | 61.1% 3,232 | 38.5% 2,036 | 0.4% 21 |
| 1936 | 55.8% 3,070 | 44.0% 2,422 | 0.2% 13 |
| 1932 | 50.6% 3,219 | 48.9% 3,116 | 0.5% 33 |
| 1928 | 73.1% 4,253 | 26.9% 1,562 | 0.0% 0 |
| 1924 | 56.5% 3,132 | 42.8% 2,373 | 0.7% 36 |
| 1920 | 60.2% 3,476 | 39.1% 2,255 | 0.7% 39 |
| 1916 | 56.0% 2,147 | 43.0% 1,647 | 1.0% 38 |
| 1912 | 35.7% 1,186 | 41.1% 1,366 | 23.3% 773 |
| Year | Republican | Democratic | Third parties |
|---|---|---|---|
| 2015 | 69.00% 2,344 | 28.76% 977 | 2.24% 76 |
| 2011 | 53.21% 1,540 | 42.19% 1,221 | 4.60% 133 |
| 2007 | 51.79% 1,955 | 48.21% 1,820 | 0.00% 0 |
| 2003 | 64.99% 2,202 | 35.01% 1,186 | 0.00% 0 |
| 1999 | 28.68% 339 | 62.69% 741 | 8.63% 102 |
| 1995 | 57.95% 1,829 | 42.05% 1,327 | 0.00% 0 |
Communities
Notable residents
See also
References
- 1 2 "State & County QuickFacts". United States Census Bureau. Archived from the original on July 6, 2011. Retrieved March 5, 2014.
- ↑ "Find a County". National Association of Counties. Archived from the original on May 31, 2011. Retrieved June 6, 2011.
- ↑ The Register of the Kentucky State Historical Society, Volume 1. Kentucky State Historical Society. 1903. p. 34.
- ↑ Hogan, Roseann Reinemuth (1992). Kentucky Ancestry: A Guide to Genealogical and Historical Research. Ancestry Publishing. p. 187. ISBN 9780916489496. Retrieved 26 July 2013.
- ↑ "2010 Census Gazetteer Files". United States Census Bureau. August 22, 2012. Archived from the original on August 12, 2014. Retrieved August 11, 2014.
- ↑ "Population and Housing Unit Estimates". Retrieved June 9, 2017.
- ↑ "U.S. Decennial Census". United States Census Bureau. Archived from the original on May 12, 2015. Retrieved August 11, 2014.
- ↑ "Historical Census Browser". University of Virginia Library. Retrieved August 11, 2014.
- ↑ "Population of Counties by Decennial Census: 1900 to 1990". United States Census Bureau. Retrieved August 11, 2014.
- ↑ "Census 2000 PHC-T-4. Ranking Tables for Counties: 1990 and 2000" (PDF). United States Census Bureau. Retrieved August 11, 2014.
- ↑ "American FactFinder". United States Census Bureau. Archived from the original on September 11, 2013. Retrieved 2008-01-31.
- ↑ Sullivan, Robert David; "How the Red and Blue Map Evolved Over the Past Century"; America Magazine in The National Catholic Review; June 29, 2016
- ↑ "Archived copy" (PDF). Archived from the original (PDF) on 2014-11-26. Retrieved 2014-11-28.
- ↑ Leip, David. "Dave Leip's Atlas of U.S. Presidential Elections". uselectionatlas.org. Retrieved 2018-06-29.
Municipalities and communities of Allen County, Kentucky, United States | ||
|---|---|---|
| City | | |
| Unincorporated communities |
| |
| Principal city | _Metro.png) | |
|---|---|---|
| Other municipalities | ||
| Counties | ||