Carroll County, Kentucky
| Carroll County, Kentucky | |
|---|---|
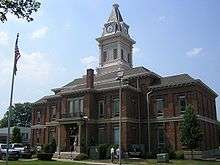 Carroll County Courthouse in Carrollton | |
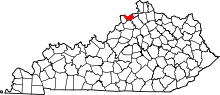 Location in the U.S. state of Kentucky | |
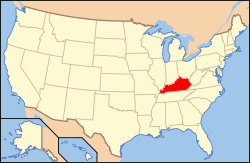 Kentucky's location in the U.S. | |
| Founded | 1838 |
| Named for | Charles Carroll of Carrollton |
| Seat | Carrollton |
| Largest city | Carrollton |
| Area | |
| • Total | 137 sq mi (355 km2) |
| • Land | 129 sq mi (334 km2) |
| • Water | 8.7 sq mi (23 km2), 6.4% |
| Population | |
| • (2010) | 10,811 |
| • Density | 84/sq mi (32/km2) |
| Congressional district | 4th |
| Time zone | Eastern: UTC−5/−4 |
| Website |
www |
Carroll County is a county located in the U.S. state of Kentucky. As of the 2010 census, the population was 10,811.[1] Its county seat is Carrollton.[2] The county was formed in 1838 and named for Charles Carroll of Carrollton, the last living signer of the Declaration of Independence.[3] It is located at the confluence of the Kentucky and Ohio Rivers.
Geography
According to the U.S. Census Bureau, the county has a total area of 137 square miles (350 km2), of which 129 square miles (330 km2) is land and 8.7 square miles (23 km2) (6.4%) is water.[4] It is the third-smallest county by area in Kentucky.
Adjacent counties
- Jefferson County, Indiana (north)
- Switzerland County, Indiana (northeast)
- Gallatin County (east)
- Owen County (southeast)
- Henry County (south)
- Trimble County (west)
Demographics
| Historical population | |||
|---|---|---|---|
| Census | Pop. | %± | |
| 1840 | 3,966 | — | |
| 1850 | 5,526 | 39.3% | |
| 1860 | 6,578 | 19.0% | |
| 1870 | 6,189 | −5.9% | |
| 1880 | 8,953 | 44.7% | |
| 1890 | 9,266 | 3.5% | |
| 1900 | 9,825 | 6.0% | |
| 1910 | 8,110 | −17.5% | |
| 1920 | 8,346 | 2.9% | |
| 1930 | 8,155 | −2.3% | |
| 1940 | 8,657 | 6.2% | |
| 1950 | 8,517 | −1.6% | |
| 1960 | 7,978 | −6.3% | |
| 1970 | 8,523 | 6.8% | |
| 1980 | 9,270 | 8.8% | |
| 1990 | 9,292 | 0.2% | |
| 2000 | 10,155 | 9.3% | |
| 2010 | 10,811 | 6.5% | |
| Est. 2016 | 10,679 | [5] | −1.2% |
| U.S. Decennial Census[6] 1790-1960[7] 1900-1990[8] 1990-2000[9] 2010-2013[1] | |||
As of the census[10] of 2000, there were 10,155 people, 3,940 households, and 2,722 families residing in the county. The population density was 78 per square mile (30/km2). There were 4,439 housing units at an average density of 34 per square mile (13/km2). The racial makeup of the county was 95.16% White, 1.94% Black or African American, 0.23% Native American, 0.17% Asian, 0.05% Pacific Islander, 1.42% from other races, and 1.04% from two or more races. 3.25% of the population were Hispanic or Latino of any race.
There were 3,940 households out of which 33.10% had children under the age of 18 living with them, 52.40% were married couples living together, 11.70% had a female householder with no husband present, and 30.90% were non-families. 25.30% of all households were made up of individuals and 10.10% had someone living alone who was 65 years of age or older. The average household size was 2.51 and the average family size was 2.98.
In the county, the population was spread out with 25.30% under the age of 18, 9.10% from 18 to 24, 29.90% from 25 to 44, 23.20% from 45 to 64, and 12.50% who were 65 years of age or older. The median age was 36 years. For every 100 females there were 101.20 males. For every 100 females age 18 and over, there were 99.00 males.
The median income for a household in the county was $35,925, and the median income for a family was $44,037. Males had a median income of $33,588 versus $20,974 for females. The per capita income for the county was $17,057. About 10.40% of families and 14.90% of the population were below the poverty line, including 19.80% of those under age 18 and 21.60% of those age 65 or over
Communities
- Carrollton (county seat)
- English
- Ghent
- Prestonville
- Sanders
- Worthville
Politics
Carroll County was strongly pro-Confederate during the Civil War: only 2.70 percent of its white population volunteered to serve in the Union Army, which constitutes the fourteenth-lowest of 109 counties extant as of the 1860 election, and was indeed lower than for the whole of seceded Tennessee.[11] Consequently, Carroll County remained overwhelmingly Democratic for the next century and a quarter, being the only Kentucky county outside the heavily unionized coalfields to vote for George McGovern in 1972. The first Republican to carry Carroll County was Ronald Reagan in 1984, and the growing social liberalism of the Democratic Party has meant the county has voted increasingly Republican since the turn of the century,[12] although Hillary Clinton's 28.69 percent – even if over fifteen percent worse than any previous Democrat – was still as good as she received in any rural white southern county.
| Year | Republican | Democratic | Third parties |
|---|---|---|---|
| 2016 | 67.1% 2,588 | 28.7% 1,106 | 4.2% 161 |
| 2012 | 54.3% 1,999 | 44.3% 1,629 | 1.4% 52 |
| 2008 | 53.0% 2,032 | 44.8% 1,716 | 2.3% 87 |
| 2004 | 55.8% 2,175 | 43.3% 1,688 | 0.9% 34 |
| 2000 | 52.0% 1,818 | 45.8% 1,601 | 2.3% 80 |
| 1996 | 36.1% 1,170 | 52.2% 1,689 | 11.7% 378 |
| 1992 | 27.9% 1,046 | 56.6% 2,119 | 15.5% 581 |
| 1988 | 46.8% 1,702 | 52.6% 1,913 | 0.6% 21 |
| 1984 | 53.7% 1,824 | 46.0% 1,564 | 0.4% 12 |
| 1980 | 32.3% 1,076 | 63.9% 2,127 | 3.8% 125 |
| 1976 | 26.3% 815 | 72.6% 2,251 | 1.1% 33 |
| 1972 | 47.7% 1,228 | 50.8% 1,308 | 1.5% 38 |
| 1968 | 27.5% 868 | 56.0% 1,765 | 16.5% 519 |
| 1964 | 15.8% 491 | 83.5% 2,592 | 0.7% 22 |
| 1960 | 33.8% 1,135 | 66.2% 2,225 | 0.0% 0 |
| 1956 | 34.1% 1,130 | 65.4% 2,169 | 0.5% 17 |
| 1952 | 28.1% 1,019 | 71.7% 2,605 | 0.2% 8 |
| 1948 | 18.7% 639 | 76.7% 2,626 | 4.7% 160 |
| 1944 | 22.0% 755 | 77.7% 2,662 | 0.3% 11 |
| 1940 | 21.6% 804 | 78.2% 2,915 | 0.3% 11 |
| 1936 | 22.4% 794 | 76.6% 2,718 | 1.0% 35 |
| 1932 | 20.1% 761 | 79.5% 3,015 | 0.5% 19 |
| 1928 | 46.9% 1,649 | 53.0% 1,863 | 0.1% 3 |
| 1924 | 36.6% 1,306 | 62.9% 2,243 | 0.6% 20 |
| 1920 | 21.9% 906 | 77.5% 3,209 | 0.6% 26 |
| 1916 | 23.2% 535 | 76.0% 1,757 | 0.8% 19 |
| 1912 | 15.1% 317 | 74.9% 1,573 | 10.0% 211 |
In gubernatorial elections, Carroll has remained solidly Democratic: as of 2017 no Republican gubernatorial candidate has ever carried the county.
See also
References
- 1 2 "State & County QuickFacts". United States Census Bureau. Retrieved March 6, 2014.
- ↑ "Find a County". National Association of Counties. Archived from the original on 2011-05-31. Retrieved 2011-06-07.
- ↑ The Register of the Kentucky State Historical Society, Volume 1. Kentucky State Historical Society. 1903. p. 34.
- ↑ "2010 Census Gazetteer Files". United States Census Bureau. August 22, 2012. Archived from the original on August 12, 2014. Retrieved August 13, 2014.
- ↑ "Population and Housing Unit Estimates". Retrieved June 9, 2017.
- ↑ "U.S. Decennial Census". United States Census Bureau. Archived from the original on May 12, 2015. Retrieved August 13, 2014.
- ↑ "Historical Census Browser". University of Virginia Library. Retrieved August 13, 2014.
- ↑ "Population of Counties by Decennial Census: 1900 to 1990". United States Census Bureau. Retrieved August 13, 2014.
- ↑ "Census 2000 PHC-T-4. Ranking Tables for Counties: 1990 and 2000" (PDF). United States Census Bureau. Retrieved August 13, 2014.
- ↑ "American FactFinder". United States Census Bureau. Archived from the original on 2013-09-11. Retrieved 2008-01-31.
- ↑ Copeland, James E.; ‘Where Were the Kentucky Unionists and Secessionists’; The Register of the Kentucky Historical Society, volume 71, no. 4 (October, 1973), pp. 344-363
- ↑ Cohn, Nate; ‘Demographic Shift: Southern Whites’ Loyalty to G.O.P. Nearing That of Blacks to Democrats’, The New York Times, April 24, 2014
- ↑ Leip, David. "Dave Leip's Atlas of U.S. Presidential Elections". uselectionatlas.org. Retrieved 2018-06-30.
External links
- Carroll County Chamber of Commerce website
- Carroll County Government Site
- The News Democrat
- Historical Images and Texts of Carroll County, Kentucky
Municipalities and communities of Carroll County, Kentucky, United States | ||
|---|---|---|
| Cities | | |
| Unincorporated communities | ||
| Ghost towns |
| |