Franklin County, Kentucky
| Franklin County, Kentucky | |
|---|---|
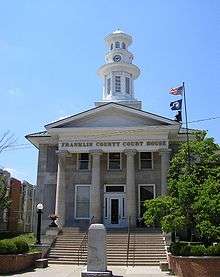 Franklin County courthouse in Frankfort | |
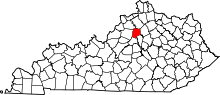 Location in the U.S. state of Kentucky | |
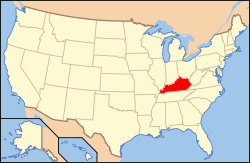 Kentucky's location in the U.S. | |
| Founded | May 10, 1795[1] |
| Named for | Benjamin Franklin |
| Seat | Frankfort |
| Largest city | Frankfort |
| Area | |
| • Total | 212 sq mi (549 km2) |
| • Land | 208 sq mi (539 km2) |
| • Water | 4.3 sq mi (11 km2), 2.0% |
| Population | |
| • (2010) | 49,285 |
| • Density | 237/sq mi (92/km2) |
| Congressional district | 6th |
| Time zone | Eastern: UTC−5/−4 |
| Website |
franklincounty |
Franklin County is a county located in the U.S. state of Kentucky. As of the 2010 census, the population was 49,285.[2] Its county seat is Frankfort,[3] the state capital. The county was formed in 1795 from parts of Woodford, Mercer and Shelby counties, and was named after the American inventor and statesman Benjamin Franklin.[4]
Franklin County is part of the Frankfort, Kentucky Micropolitan Statistical Area.
History
The three original counties of Kentucky (Jefferson, Fayette and Lincoln counties) intersected in what is today Franklin County. Franklin County was established in 1795 from land given by Mercer, Shelby, and Woodford counties.[5] Franklin was the 18th Kentucky county in order of formation.[6]
Geography
According to the U.S. Census Bureau, the county has a total area of 212 square miles (550 km2), of which 208 square miles (540 km2) is land and 4.3 square miles (11 km2) (2.0%) is water.[7]
Major highways
Adjacent counties
- Owen County (north)
- Scott County (east)
- Woodford County (southeast)
- Anderson County (south)
- Shelby County (west)
- Henry County (northwest)
Government and politics
Franklin County's voter registration is overwhelmingly Democratic. Registered Democrats outnumber Republicans by a ratio of more than 4 to 1.[8] However, in national elections the county has supported both Democrats and Republicans. In 2000 Democrat Al Gore won 50% of the vote to Republican George W. Bush's 47%. In 2004, Bush won 50% of the vote to Democrat John Kerry's 48%. In 2008 Republican John McCain defeated Democrat Barack Obama 49.47% to 48.87%, a difference of only 144 votes.
| Year | Republican | Democratic | Third parties |
|---|---|---|---|
| 2016 | 49.5% 11,819 | 44.9% 10,717 | 5.6% 1,329 |
| 2012 | 48.6% 11,345 | 49.4% 11,535 | 2.0% 457 |
| 2008 | 49.5% 11,911 | 48.9% 11,767 | 1.7% 401 |
| 2004 | 50.9% 12,281 | 48.2% 11,620 | 1.0% 232 |
| 2000 | 47.2% 10,209 | 50.1% 10,853 | 2.7% 592 |
| 1996 | 35.0% 7,132 | 55.2% 11,251 | 9.7% 1,984 |
| 1992 | 36.1% 7,591 | 47.1% 9,896 | 16.9% 3,544 |
| 1988 | 50.9% 9,805 | 48.1% 9,271 | 1.0% 195 |
| 1984 | 58.1% 11,057 | 41.0% 7,790 | 0.9% 177 |
| 1980 | 34.8% 6,455 | 60.4% 11,193 | 4.8% 882 |
| 1976 | 33.7% 5,536 | 63.7% 10,475 | 2.6% 430 |
| 1972 | 56.9% 7,781 | 41.0% 5,601 | 2.2% 297 |
| 1968 | 30.8% 4,057 | 48.6% 6,396 | 20.6% 2,712 |
| 1964 | 18.6% 2,320 | 81.1% 10,130 | 0.4% 44 |
| 1960 | 40.2% 4,742 | 59.8% 7,052 | 0.0% 0 |
| 1956 | 38.4% 4,047 | 60.8% 6,412 | 0.9% 94 |
| 1952 | 29.8% 3,097 | 70.2% 7,309 | 0.1% 5 |
| 1948 | 21.8% 1,962 | 74.2% 6,679 | 4.0% 362 |
| 1944 | 24.3% 2,050 | 75.2% 6,356 | 0.5% 42 |
| 1940 | 21.7% 1,927 | 78.2% 6,956 | 0.2% 14 |
| 1936 | 24.3% 2,010 | 75.4% 6,222 | 0.3% 26 |
| 1932 | 24.2% 2,034 | 75.3% 6,331 | 0.5% 39 |
| 1928 | 47.5% 3,485 | 52.5% 3,853 | 0.1% 7 |
| 1924 | 37.2% 2,826 | 61.5% 4,678 | 1.4% 102 |
| 1920 | 31.5% 2,710 | 68.3% 5,878 | 0.2% 21 |
| 1916 | 29.7% 1,426 | 69.7% 3,345 | 0.6% 30 |
| 1912 | 17.9% 783 | 67.9% 2,980 | 14.2% 624 |
Demographics
| Historical population | |||
|---|---|---|---|
| Census | Pop. | %± | |
| 1800 | 5,078 | — | |
| 1810 | 8,013 | 57.8% | |
| 1820 | 11,024 | 37.6% | |
| 1830 | 9,254 | −16.1% | |
| 1840 | 9,420 | 1.8% | |
| 1850 | 12,462 | 32.3% | |
| 1860 | 12,694 | 1.9% | |
| 1870 | 15,300 | 20.5% | |
| 1880 | 18,699 | 22.2% | |
| 1890 | 21,267 | 13.7% | |
| 1900 | 20,852 | −2.0% | |
| 1910 | 21,135 | 1.4% | |
| 1920 | 19,357 | −8.4% | |
| 1930 | 21,064 | 8.8% | |
| 1940 | 23,308 | 10.7% | |
| 1950 | 25,933 | 11.3% | |
| 1960 | 29,421 | 13.5% | |
| 1970 | 34,481 | 17.2% | |
| 1980 | 41,830 | 21.3% | |
| 1990 | 43,781 | 4.7% | |
| 2000 | 47,687 | 8.9% | |
| 2010 | 49,285 | 3.4% | |
| Est. 2016 | 50,560 | [10] | 2.6% |
| U.S. Decennial Census[11] 1790-1960[12] 1900-1990[13] 1990-2000[14] 2010-2013[2] | |||
As of the census[15] of 2000, there were 47,687 people, 19,907 households, and 12,840 families residing in the county. The population density was 227 per square mile (88/km2). There were 21,409 housing units at an average density of 102 per square mile (39/km2). The racial makeup of the county was 87.98% White, 9.36% Black or African American, 0.13% Native American, 0.72% Asian, 0.02% Pacific Islander, 0.55% from other races, and 1.24% from two or more races. 1.11% of the population were Hispanic or Latino of any race.
There were 19,907 households out of which 29.50% had children under the age of 18 living with them, 48.70% were married couples living together, 12.20% had a female householder with no husband present, and 35.50% were non-families. 30.40% of all households were made up of individuals and 10.60% had someone living alone who was 65 years of age or older. The average household size was 2.30 and the average family size was 2.86.
22.60% of the population was under the age of 18, 9.70% from 18 to 24, 30.50% from 25 to 44, 24.90% from 45 to 64, and 12.30% who were 65 years of age or older. The median age was 37 years. For every 100 females, there were 93.70 males. For every 100 females age 18 and over, there were 89.70 males.
The median income for a household in the county was $40,011, and the median income for a family was $51,052. Males had a median income of $32,826 versus $26,201 for females. The per capita income for the county was $21,229. About 6.90% of families and 10.70% of the population were below the poverty line, including 12.80% of those under age 18 and 12.20% of those age 65 or over.
Education
The county is served by two public school districts: Franklin County Public Schools and Frankfort Independent Schools.
Franklin County Public Schools
This district takes in almost all of the county, including the majority of the city of Frankfort. It operates the following schools:
- Bridgeport Elementary School (grades K-5)
- Collins Lane Elementary School (grades K-5)
- Early Childhood Education Center (grades K-1)
- Elkhorn Elementary School (grades 2-5)
- Hearn Elementary School (grades 2-5)
- Peaks Mill Elementary School (grades 2-5)
- Westridge Elementary School (grades K-5)
- Bondurant Middle School (grades 6-8)
- Elkhorn Middle School (grades 6-8)
- Franklin County High School (grades 9-12)
- Western Hills High School (grades 9-12)
- The Academy (grades 9-12) (For kids with problems/juveniles)
- Franklin County Career and Technical Center (grades 9-12) (Career center for all public high schools in the county.)
Frankfort Independent Schools
This district serves an area roughly covering the Frankfort neighborhoods known as "downtown", South Frankfort (the vicinity of the state capitol building), and Bellepoint. It operates two schools:
- Second Street School (grades K-6)
- Frankfort High School (grades 7-12)
Private schools
- Capital Day School (grades PreK-8)
- Frankfort Christian Academy (grades K-12)
- Good Shepherd Catholic School (grades PreK-8)
University
Parks
- Capitol View Park
- Cove Spring Park and Nature Preserve
- Dolly Graham Park
- East Frankfort Park
- Josephine Sculpture Park
- Juniper Hill Park and Golf Course
- Lakeview Park
- Leslie Morris Park on Fort Hill: 120 acres (0.49 km2) of woodland overlooking downtown Frankfort. It contains trails that guide visitors through the remains of earthwork forts that were the main defensive position for Union troops protecting the city during an 1864 Civil War skirmish.
- Riverview Park
- Todd Park
Communities
- Bridgeport
- Forks of Elkhorn
- Frankfort (county seat)
- Jett
- Switzer
- Peaks Mill
- Bald Knob, Kentucky
See also
References
- ↑ "Kentucky: County – Franklin – Welcome". Franklincounty.ky.gov. Retrieved 2011-12-11.
- 1 2 "State & County QuickFacts". United States Census Bureau. Archived from the original on July 10, 2011. Retrieved March 6, 2014.
- ↑ "Find a County". National Association of Counties. Archived from the original on 2011-05-31. Retrieved 2011-06-07.
- ↑ The Register of the Kentucky State Historical Society, Volume 1. Kentucky State Historical Society. 1903. p. 35.
- ↑ Hogan, Roseann Reinemuth (1992). Kentucky Ancestry: A Guide to Genealogical and Historical Research. Ancestry Publishing. p. 232. Retrieved 26 July 2013.
- ↑ Collins, Lewis (1882). Collins' Historical Sketches of Kentucky: History of Kentucky, Volume 2. Collins & Company. p. 26.
- ↑ "2010 Census Gazetteer Files". United States Census Bureau. August 22, 2012. Archived from the original on August 12, 2014. Retrieved August 14, 2014.
- ↑ "Kentucky State Board of Elections Welcome to the State Board of Elections". Elect.ky.gov. Archived from the original on 2009-09-10. Retrieved 2011-12-11.
- ↑ Leip, David. "Dave Leip's Atlas of U.S. Presidential Elections". uselectionatlas.org. Retrieved 9 April 2018.
- ↑ "Population and Housing Unit Estimates". Retrieved June 9, 2017.
- ↑ "U.S. Decennial Census". United States Census Bureau. Archived from the original on May 12, 2015. Retrieved August 14, 2014.
- ↑ "Historical Census Browser". University of Virginia Library. Retrieved August 14, 2014.
- ↑ "Population of Counties by Decennial Census: 1900 to 1990". United States Census Bureau. Retrieved August 14, 2014.
- ↑ "Census 2000 PHC-T-4. Ranking Tables for Counties: 1990 and 2000" (PDF). United States Census Bureau. Retrieved August 14, 2014.
- ↑ "American FactFinder". United States Census Bureau. Archived from the original on 2013-09-11. Retrieved 2008-01-31.
External links
Coordinates: 38°14′N 84°53′W / 38.24°N 84.88°W
Municipalities and communities of Franklin County, Kentucky, United States | ||
|---|---|---|
| City | | |
| Unincorporated communities | ||