Elliott County, Kentucky
| Elliott County, Kentucky | |
|---|---|
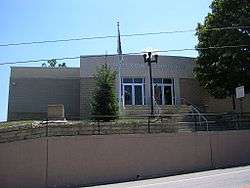 Elliott County courthouse in Sandy Hook | |
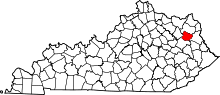 Location in the U.S. state of Kentucky | |
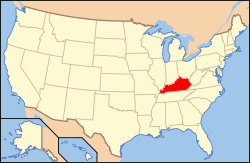 Kentucky's location in the U.S. | |
| Founded | 1869 |
| Named for | John Lisle Elliott or John Milton Elliott |
| Seat | Sandy Hook |
| Largest city | Sandy Hook |
| Area | |
| • Total | 235 sq mi (609 km2) |
| • Land | 234 sq mi (606 km2) |
| • Water | 1.0 sq mi (3 km2), 0.4% |
| Population | |
| • (2010) | 7,852 |
| • Density | 34/sq mi (13/km2) |
| Congressional district | 5th |
| Time zone | Eastern: UTC−5/−4 |
| Website |
elliottcounty |
Elliott County is a county located in the U.S. state of Kentucky. As of the 2010 census, the population was 7,852.[1] Its county seat is Sandy Hook.[2] The county was formed in 1869 from parts of Morgan, Lawrence, and Carter counties, and is named for John Milton Elliott, U.S. Congressman; Confederate Justice of the Kentucky Court of Appeals.[3][4] In regard to alcohol sales, Elliott County is a dry county, meaning the sale of alcoholic beverages is prohibited everywhere in the county.
History
Elliott County was established in 1869 from land given by Carter, Lawrence, and Morgan counties. A fire at the courthouse in 1957 resulted in the destruction of many county records.[5]
Geography
According to the U.S. Census Bureau, the county has a total area of 235 square miles (610 km2), of which 234 square miles (610 km2) is land and 1.0 square mile (2.6 km2) (0.4%) is water.[6]
Adjacent counties
- Carter County (north)
- Lawrence County (east)
- Morgan County (south)
- Rowan County (west)
Politics
Elliott County had voted for the Democratic Party's nominee in every presidential election since it was formed in 1869, up until the 2016 presidential election when it voted 70-26 in favor of Donald Trump.[7] This was the longest streak of any county voting Democratic in the United States.[8] It was also the last Southern rural county to have never voted for a Republican in any Presidential election, until 2016.[7] Even in nationwide Republican landslides like 1972 and 1984, when Republicans were winning the state of Kentucky overall with more than 60% of the vote, Elliot County voted 65.3% and 73.4% Democratic, respectively.
Elliott County was the second-whitest county in the country, at 99.04%, to vote for Democrat Barack Obama in the 2008 Presidential election, the whitest being Mitchell County, Iowa. Obama garnered 61% of the vote, while Republican John McCain received 36%. In 2008, Elliott County provided Obama with the highest winning percentage of the vote out of all Kentucky counties. This made it the most Democratic county in the state for the 2nd election in a row, since it had also been Democrat John Kerry's strongest county in Kentucky in 2004.[9] Obama would again win the county in 2012, his only county victory in traditionally staunchly conservative rural Eastern Kentucky. However he would only eke out a narrow 49% plurality over Mitt Romney's 47%, a lead of just 60 votes, thus nearly ending a long streak of Democratic landslides in Elliott County. Reflecting the increased rural-urban divide in modern American politics, Obama's strongest county in the state was instead Jefferson County, home to the state's largest city, Louisville, which he won by a much more comfortable 54.69%-43.60% margin.
In 2016, Elliott County voted for Donald Trump, the Republican candidate, by 2,000 votes (70.1%) to 740 (25.9%) for Democrat Hillary Clinton,[10] decisively ending the Democratic Party's 144 year victory streak.[7] Despite this feat, Trump's victory carried no coattails in the county during the coinciding senate race as Jim Gray, the Democratic nominee, won the county by 1,477 votes (56.07%) to 1,157 (43.93%) for Republican Senator Rand Paul. However, the area the County occupies voted Republican in the 1868 election, a year before the County was founded.[11]
Elliott County is the only county in Kentucky that has voted against Senator Mitch McConnell in each of his elections.
As of 2014, Elliott County had the fewest number of registered Republicans, 248, out of all counties in Kentucky.[12] By 2016, it had increased to 429, out of 5,214 registered voters.[7]
| Year | Republican | Democratic | Third parties |
|---|---|---|---|
| 2016 | 70.1% 2,000 | 25.9% 740 | 4.0% 115 |
| 2012 | 46.9% 1,126 | 49.4% 1,186 | 3.6% 87 |
| 2008 | 35.9% 902 | 61.0% 1,535 | 3.1% 78 |
| 2004 | 29.5% 871 | 69.8% 2,064 | 0.7% 22 |
| 2000 | 34.7% 827 | 64.1% 1,525 | 1.2% 29 |
| 1996 | 20.9% 421 | 64.4% 1,298 | 14.7% 296 |
| 1992 | 17.6% 444 | 71.1% 1,796 | 11.3% 285 |
| 1988 | 23.3% 550 | 76.2% 1,797 | 0.4% 10 |
| 1984 | 26.2% 601 | 73.4% 1,683 | 0.4% 10 |
| 1980 | 24.6% 551 | 74.4% 1,668 | 1.0% 22 |
| 1976 | 18.5% 455 | 80.7% 1,987 | 0.8% 19 |
| 1972 | 34.0% 782 | 65.3% 1,499 | 0.7% 16 |
| 1968 | 23.6% 515 | 63.5% 1,387 | 13.0% 284 |
| 1964 | 13.7% 323 | 86.2% 2,026 | 0.1% 2 |
| 1960 | 31.3% 789 | 68.7% 1,734 | 0.0% 0 |
| 1956 | 32.5% 1,033 | 67.5% 2,143 | 0.0% 0 |
| 1952 | 23.3% 629 | 76.7% 2,074 | 0.0% 0 |
| 1948 | 16.3% 410 | 83.2% 2,095 | 0.6% 14 |
| 1944 | 23.0% 514 | 77.0% 1,721 | 0.0% 0 |
| 1940 | 24.0% 634 | 76.1% 2,013 | 0.0% 0 |
| 1936 | 23.8% 480 | 76.2% 1,539 | 0.0% 0 |
| 1932 | 15.1% 382 | 84.9% 2,150 | 0.0% 0 |
| 1928 | 31.3% 601 | 68.7% 1,317 | 0.0% 0 |
| 1924 | 26.2% 614 | 72.5% 1,702 | 1.3% 31 |
| 1920 | 32.6% 860 | 66.9% 1,764 | 0.5% 13 |
| 1916 | 31.1% 525 | 68.2% 1,151 | 0.7% 11 |
| 1912 | 25.7% 396 | 65.3% 1,006 | 9.0% 139 |
Demographics
| Historical population | |||
|---|---|---|---|
| Census | Pop. | %± | |
| 1870 | 4,433 | — | |
| 1880 | 6,567 | 48.1% | |
| 1890 | 9,214 | 40.3% | |
| 1900 | 10,387 | 12.7% | |
| 1910 | 9,814 | −5.5% | |
| 1920 | 8,887 | −9.4% | |
| 1930 | 7,571 | −14.8% | |
| 1940 | 8,713 | 15.1% | |
| 1950 | 7,085 | −18.7% | |
| 1960 | 6,330 | −10.7% | |
| 1970 | 5,933 | −6.3% | |
| 1980 | 6,908 | 16.4% | |
| 1990 | 6,455 | −6.6% | |
| 2000 | 6,748 | 4.5% | |
| 2010 | 7,852 | 16.4% | |
| Est. 2016 | 7,588 | [14] | −3.4% |
| U.S. Decennial Census[15] 1790-1960[16] 1900-1990[17] 1990-2000[18] 2010-2013[1] | |||
As of the census[19] of 2000, there were 6,748 people, 2,638 households, and 1,925 families residing in the county. The population density was 29 per square mile (11/km2). There were 3,107 housing units at an average density of 13 per square mile (5.0/km2). The racial makeup of the county was 99.04% White, 0.03% Black or African American, 0.07% Native American, 0.01% Pacific Islander, 0.01% from other races, and 0.83% from two or more races. 0.59% of the population were Hispanic or Latino of any race.
There were 2,638 households, of which 33.40% had children under the age of 18 living with them, 60.00% were married couples living together, 9.70% had a female householder with no husband present, and 27.00% were non-families. 24.70% of all households were made up of individuals and 11.00% had someone living alone who was 65 years of age or older. The average household size was 2.54 and the average family size was 3.02.
People of British ancestry form an overwhelming plurality in Elliott County.[20][21][22][23][24]
In the county, the population was spread out with 25.40% under the age of 18, 9.10% from 18 to 24, 27.50% from 25 to 44, 24.70% from 45 to 64, and 13.40% who were 65 years of age or older. The median age was 37 years. For every 100 females there were 95.20 males. For every 100 females age 18 and over, there were 93.50 males.
The median income for a household in the county was $21,014, and the median income for a family was $27,125. Males had a median income of $29,593 versus $20,339 for females. The per capita income for the county was $12,067. About 20.80% of families and 25.90% of the population were below the poverty line, including 30.50% of those under age 18 and 26.40% of those age 65 or over.
Communities
- Ault
- Bascom
- Beartown
- Bell City
- Bigstone
- Blaines Trace
- Bruin
- Brushy Fork
- Burke
- Clay Fork
- Cliffside
- Culver
- Devil Fork
- Dewdrop
- Dobbins
- Edsel
- Eldridge
- Fannin
- Fannin Valley
- Faye
- Fielden
- Forks of Newcombe
- Gimlet
- Gomez
- Green
- Halcom
- Ibex
- Isonville
- Little Fork
- Little Sandy
- Lytten
- Middle Fork
- Neil Howard's Creek
- Newcombe
- Newfoundland
- Ordinary
- Roscoe
- Shady Grove
- Sandy Hook (county seat)
- Sarah
- Sideway
- Spanglin
- Stark
- Stephens
- The Ridge
- Wells Creek
- Wyatt
See also
References
- 1 2 "State & County QuickFacts". United States Census Bureau. Archived from the original on July 9, 2011. Retrieved March 6, 2014.
- ↑ "Find a County". National Association of Counties. Archived from the original on 2011-05-31. Retrieved 2011-06-07.
- ↑ The Register of the Kentucky State Historical Society, Volume 1. Kentucky State Historical Society. 1903. p. 35.
- ↑ Gannett, Henry (1905). The Origin of Certain Place Names in the United States. Govt. Print. Off. p. 117.
- ↑ Hogan, Roseann Reinemuth (1992). Kentucky Ancestry: A Guide to Genealogical and Historical Research. Ancestry Publishing. p. 225. Retrieved 26 July 2013.
- ↑ "2010 Census Gazetteer Files". United States Census Bureau. August 22, 2012. Archived from the original on August 12, 2014. Retrieved August 14, 2014.
- 1 2 3 4 Simon, Jeff (December 9, 2016). "How Trump Ended Democrats' 144-Year Winning Streak in One County". CNN. Retrieved December 10, 2016.
- ↑ "Dave Leip's Atlas of U.S. Presidential Elections". uselectionatlas.org. Retrieved 10 April 2018.
- ↑ NYT Electoral explorer Archived 2009-02-06 at the Wayback Machine.
- ↑ "Kentucky President Results 2016". CNN. 2016-11-08. Retrieved 2016-11-08.
- ↑ https://uselectionatlas.org/FORUM/index.php?topic=45974.msg2009879#msg2009879. Missing or empty
|title=(help) - ↑ VOTER REGISTRATION STATISTICS REPORT, Kentucky Secretary of State Retrieved 26 November 2014.
- ↑ Leip, David. "Dave Leip's Atlas of U.S. Presidential Elections". uselectionatlas.org. Retrieved 10 April 2018.
- ↑ "Population and Housing Unit Estimates". Retrieved June 9, 2017.
- ↑ "U.S. Decennial Census". United States Census Bureau. Archived from the original on May 12, 2015. Retrieved August 14, 2014.
- ↑ "Historical Census Browser". University of Virginia Library. Retrieved August 14, 2014.
- ↑ "Population of Counties by Decennial Census: 1900 to 1990". United States Census Bureau. Retrieved August 14, 2014.
- ↑ "Census 2000 PHC-T-4. Ranking Tables for Counties: 1990 and 2000" (PDF). United States Census Bureau. Retrieved August 14, 2014.
- ↑ "American FactFinder". United States Census Bureau. Archived from the original on 2013-09-11. Retrieved 2008-01-31.
- ↑ "Ancestry of the Population by State: 1980 - Table 3" (PDF). Retrieved 2012-02-10.
- ↑ Sharing the Dream: White Males in a Multicultural America By Dominic J. Pulera.
- ↑ Reynolds Farley, 'The New Census Question about Ancestry: What Did It Tell Us?', Demography, Vol. 28, No. 3 (August 1991), pp. 414, 421.
- ↑ Stanley Lieberson and Lawrence Santi, 'The Use of Nativity Data to Estimate Ethnic Characteristics and Patterns', Social Science Research, Vol. 14, No. 1 (1985), pp. 44-6.
- ↑ Stanley Lieberson and Mary C. Waters, 'Ethnic Groups in Flux: The Changing Ethnic Responses of American Whites', Annals of the American Academy of Political and Social Science, Vol. 487, No. 79 (September 1986), pp. 82-86.
External links
- The Year of Plenty, children's historical fiction set in Elliott County
- The Kentucky Highlands Project
- Elliott County Chamber of Commerce
Municipalities and communities of Elliott County, Kentucky, United States | ||
|---|---|---|
| City | | |
| Unincorporated communities | ||