Leslie County, Kentucky
| Leslie County, Kentucky | |
|---|---|
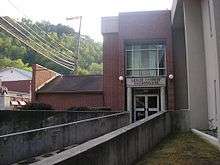 Leslie County courthouse in Hyden | |
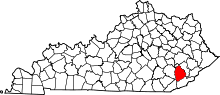 Location in the U.S. state of Kentucky | |
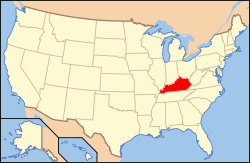 Kentucky's location in the U.S. | |
| Founded | 1878 |
| Named for | Preston Leslie |
| Seat | Hyden |
| Largest city | Hyden |
| Area | |
| • Total | 404 sq mi (1,046 km2) |
| • Land | 401 sq mi (1,039 km2) |
| • Water | 3.6 sq mi (9 km2), 0.9% |
| Population | |
| • (2010) | 11,310 |
| • Density | 28/sq mi (11/km2) |
| Congressional district | 5th |
| Time zone | Eastern: UTC−5/−4 |
| Website |
www |
Leslie County is a county located in the U.S. state of Kentucky. As of the 2010 census, the population was 11,310.[1] Its county seat is Hyden.[2] Leslie is a prohibition or dry county.
History
Leslie County was founded in 1878. It was named for Preston H. Leslie, Governor of Kentucky (1871-1875).[3]
The Hurricane Creek mine disaster in a Leslie County coal mine in 1970 killed 38 people.[4]
After resigning the presidency, Richard Nixon made his first public appearance at the Leslie County dedication of a recreation facility named for him. County Judge-Executive C. Allen Muncy claimed the Nixon invitation prompted the U.S. Department of Justice to obtain indictments of him and his associates on vote-fraud charges; while on appeal for his conviction, he won renomination in the Republican primary but lost the 1981 general election to independent Kermit Keen.[5]
Geography
According to the U.S. Census Bureau, the county has a total area of 404 square miles (1,050 km2), of which 401 square miles (1,040 km2) is land and 3.6 square miles (9.3 km2) (0.9%) is water.[6]
Adjacent counties
- Perry County (northeast)
- Harlan County (southeast)
- Bell County (southwest)
- Clay County (west)
Demographics
| Historical population | |||
|---|---|---|---|
| Census | Pop. | %± | |
| 1880 | 3,740 | — | |
| 1890 | 3,964 | 6.0% | |
| 1900 | 6,753 | 70.4% | |
| 1910 | 8,976 | 32.9% | |
| 1920 | 10,097 | 12.5% | |
| 1930 | 10,765 | 6.6% | |
| 1940 | 14,981 | 39.2% | |
| 1950 | 15,537 | 3.7% | |
| 1960 | 10,941 | −29.6% | |
| 1970 | 11,623 | 6.2% | |
| 1980 | 14,882 | 28.0% | |
| 1990 | 13,642 | −8.3% | |
| 2000 | 12,401 | −9.1% | |
| 2010 | 11,310 | −8.8% | |
| Est. 2016 | 10,538 | [7] | −6.8% |
| U.S. Decennial Census[8] 1790-1960[9] 1900-1990[10] 1990-2000[11] 2010-2013[1] | |||
As of the census[12] of 2000, there were 12,401 people, 4,885 households, and 3,668 families residing in the county. The population density was 31 per square mile (12/km2). There were 5,502 housing units at an average density of 14 per square mile (5.4/km2). The racial makeup of the county was 97.18% White, 0.07% Black or African American, 0.09% Native American, 0.12% Asian, 0.02% Pacific Islander, 0.05% from other races, and 0.50% from two or more races; 0.62% of the population were Hispanic or Latino of any race.
There were 4,885 households out of which 35.50% had children under the age of 18 living with them, 58.30% were married couples living together, 12.90% had a female householder with no husband present, and 24.90% were non-families. 22.40% of all households were made up of individuals and 8.70% had someone living alone who was 65 years of age or older. The average household size was 2.52 and the average family size was 2.94.
In the county, the population was spread out with 24.60% under the age of 18, 9.20% from 18 to 24, 30.90% from 25 to 44, 23.90% from 45 to 64, and 11.50% who were 65 years of age or older. The median age was 36 years. For every 100 females there were 95.10 males. For every 100 females age 18 and over, there were 91.20 males.
The median income for a household in the county was $18,546, and the median income for a family was $22,225. Males had a median income of $28,708 versus $18,080 for females. The per capita income for the county was $10,429. About 30.20% of families and 32.70% of the population were below the poverty line, including 38.80% of those under age 18 and 27.00% of those age 65 or over.
Economy
Coal companies in Leslie County
Infrastructure
Transportation
Public transportation is provided by LKLP Community Action Partnership with demand-response service and scheduled service from Hyden to Hazard.[15]
Communities
- Asher
- Bear Branch
- Big Rock
- Causey
- Chappell
- Cinda
- Confluence
- Cutshin
- Essie
- Frew
- Grassy
- Hare
- Hell for Certain
- Helton
- Hoskinston
- Hyden (county seat)
- Kaliopi
- Middlefork
- Mozelle
- Roark
- Sizerock
- Smilax
- Stinnett
- Thousandsticks
- Toulouse
- Warbranch
- Wendover
- Wooton
- Yeaddis
Politics
Leslie County is one of forty-four United States counties[lower-alpha 1] to have never voted for a Democratic Presidential candidate since its creation in 1878. In 1892[16], 1908, and 1916[17] it was the most Republican county in the nation. Leslie’s fierce Unionist sympathies, so strong that areas surrounding it contributed more troops to the Union Army relative to population than any other part of the United States,[18] meant that between 1896 and 1928 no Democrat could receive even ten percent of the county’s vote,[19] and none received so much as twenty percent until Lyndon Johnson flukishly managed over 47 percent in his landslide national triumph against Barry Goldwater in 1964.
Despite Goldwater’s relatively poor performance, every Republican candidate since the county's formation has obtained an absolute majority in Leslie County, and only William Howard Taft in the divided 1912 election,[19] George Bush senior in 1992, and Bob Dole in 1996 have ever received under seventy percent for the GOP.
| Year | Republican | Democratic | Third parties |
|---|---|---|---|
| 2016 | 89.4% 4,015 | 8.9% 400 | 1.7% 77 |
| 2012 | 89.6% 4,439 | 8.7% 433 | 1.6% 81 |
| 2008 | 81.3% 3,574 | 17.4% 766 | 1.3% 57 |
| 2004 | 73.8% 3,661 | 25.5% 1,266 | 0.8% 37 |
| 2000 | 71.2% 3,159 | 27.3% 1,210 | 1.5% 65 |
| 1996 | 56.1% 2,296 | 35.8% 1,466 | 8.0% 328 |
| 1992 | 58.3% 2,879 | 32.2% 1,591 | 9.4% 466 |
| 1988 | 74.4% 3,280 | 25.1% 1,105 | 0.5% 24 |
| 1984 | 75.6% 3,385 | 24.0% 1,075 | 0.3% 15 |
| 1980 | 71.9% 3,536 | 27.0% 1,327 | 1.2% 58 |
| 1976 | 71.5% 3,770 | 28.0% 1,478 | 0.4% 23 |
| 1972 | 77.9% 3,299 | 21.6% 913 | 0.6% 24 |
| 1968 | 71.1% 2,615 | 22.5% 828 | 6.4% 236 |
| 1964 | 52.2% 1,971 | 47.6% 1,795 | 0.2% 8 |
| 1960 | 83.1% 3,894 | 17.0% 795 | |
| 1956 | 87.4% 3,770 | 12.3% 531 | 0.3% 14 |
| 1952 | 81.8% 3,239 | 17.8% 705 | 0.4% 15 |
| 1948 | 73.9% 2,397 | 24.2% 783 | 1.9% 62 |
| 1944 | 84.3% 2,679 | 15.7% 499 | 0.0% 0 |
| 1940 | 84.0% 3,292 | 16.0% 626 | 0.1% 3 |
| 1936 | 81.4% 2,716 | 18.5% 618 | 0.1% 3 |
| 1932 | 83.0% 2,810 | 16.8% 569 | 0.2% 8 |
| 1928 | 94.5% 2,806 | 5.4% 159 | 0.2% 6 |
| 1924 | 88.9% 2,052 | 9.7% 223 | 1.4% 33 |
| 1920 | 94.2% 2,576 | 5.2% 142 | 0.6% 16 |
| 1916 | 91.6% 1,516 | 8.0% 133 | 0.4% 6 |
| 1912 | 53.0% 606 | 9.2% 105 | 37.8% 433 |
See also
References
- 1 2 "State & County QuickFacts". United States Census Bureau. Archived from the original on July 13, 2011. Retrieved March 6, 2014.
- ↑ "Find a County". National Association of Counties. Archived from the original on May 31, 2011. Retrieved 2011-06-07.
- ↑ The Register of the Kentucky State Historical Society, Volume 1. Kentucky State Historical Society. 1903. p. 36.
- ↑ http://www.kyenc.org/entry/l/LESLI02.html
- ↑ "The Big Lever," Appalshop Inc., 1982
- ↑ "2010 Census Gazetteer Files". United States Census Bureau. August 22, 2012. Archived from the original on August 12, 2014. Retrieved August 17, 2014.
- ↑ "Population and Housing Unit Estimates". Retrieved June 9, 2017.
- ↑ "U.S. Decennial Census". United States Census Bureau. Archived from the original on May 12, 2015. Retrieved August 17, 2014.
- ↑ "Historical Census Browser". University of Virginia Library. Retrieved August 17, 2014.
- ↑ "Population of Counties by Decennial Census: 1900 to 1990". United States Census Bureau. Retrieved August 17, 2014.
- ↑ "Census 2000 PHC-T-4. Ranking Tables for Counties: 1990 and 2000" (PDF). United States Census Bureau. Retrieved August 17, 2014.
- ↑ "American FactFinder". United States Census Bureau. Archived from the original on September 11, 2013. Retrieved 2008-01-31.
- ↑ James River Coal Company – Blue Diamond complex
- ↑ James River Coal Company – Bledsoe complex
- ↑ "LKLP Community Action Council, Inc. > Programs > Public Transportation". Retrieved 2015-05-19.
- ↑ Góelections; Popular Vote at the Presidential Election of 1892
- ↑ Dave Leip’s U.S. Election Atlas; 1916 Presidential Election Statistics
- ↑ Marshall, Anne E.; Creating a Confederate Kentucky: The Lost Cause and Civil War Memory in a Border State, pp. 114-115 ISBN 1469609835
- 1 2 Robinson, Edgar Eugene; The Presidential Vote 1896-1932, p. 270 ISBN 9780804716963
- ↑ Leip, David. "Dave Leip's Atlas of U.S. Presidential Elections". uselectionatlas.org. Retrieved 2018-07-03.
Notes
- ↑ Thirty-eight counties have never voted Democratic since the Civil War, whilst Clinton County and Cumberland County in Kentucky last did so in 1868, and Mitchell County, North Carolina, Lewis County, Kentucky alongside Tennesee’s Henderson County and Wayne County last voted Democratic for Samuel J. Tilden in 1876.
External links
- The Kentucky Highlands Project
- LeslieCounty.Net - oldest and largest site dealing with Leslie County
Municipalities and communities of Leslie County, Kentucky, United States | ||
|---|---|---|
| City | | |
| Unincorporated communities | ||