Taylor County, Kentucky
| Taylor County, Kentucky | |
|---|---|
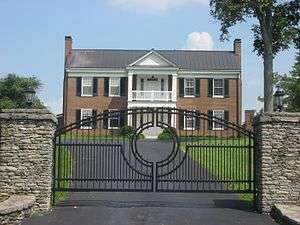 Entrance to Clay Hill, located along Kentucky Route 289. | |
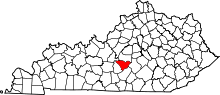 Location in the U.S. state of Kentucky | |
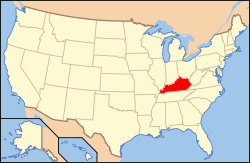 Kentucky's location in the U.S. | |
| Founded | 1848 |
| Seat | Campbellsville |
| Largest city | Campbellsville |
| Area | |
| • Total | 277 sq mi (717 km2) |
| • Land | 266 sq mi (689 km2) |
| • Water | 10 sq mi (26 km2), 3.8% |
| Population | |
| • (2010) | 24,512 |
| • Density | 92/sq mi (36/km2) |
| Congressional district | 1st |
| Time zone | Eastern: UTC−5/−4 |
| Website |
www |
Taylor County is a county located in the U.S. state of Kentucky. As of the 2010 census, the population was 24,512.[1] Its county seat is Campbellsville.[2] Settled from Virginia, Pennsylvania, Maryland, and North Carolina after the Revolutionary War, the county was organized in 1848 in the Highland Rim region. It was named for General Zachary Taylor, later President of the United States.[3]
Taylor County was the one-hundredth county created by Kentucky.
The Campbellsville Micropolitan Statistical Area includes all of Taylor County.
Geography
According to the U.S. Census Bureau, the county has a total area of 277 square miles (720 km2), of which 266 square miles (690 km2) is land and 10 square miles (26 km2) (3.8%) is water.[4]
Adjacent counties
- Marion County (north)
- Casey County (east)
- Adair County (southeast/CST Border)
- Green County (south & west/CST Border)
- LaRue County (northwest)
Demographics
| Historical population | |||
|---|---|---|---|
| Census | Pop. | %± | |
| 1850 | 7,250 | — | |
| 1860 | 7,481 | 3.2% | |
| 1870 | 8,226 | 10.0% | |
| 1880 | 9,259 | 12.6% | |
| 1890 | 9,353 | 1.0% | |
| 1900 | 11,075 | 18.4% | |
| 1910 | 11,961 | 8.0% | |
| 1920 | 12,236 | 2.3% | |
| 1930 | 12,047 | −1.5% | |
| 1940 | 13,556 | 12.5% | |
| 1950 | 14,403 | 6.2% | |
| 1960 | 16,285 | 13.1% | |
| 1970 | 17,138 | 5.2% | |
| 1980 | 21,178 | 23.6% | |
| 1990 | 21,146 | −0.2% | |
| 2000 | 22,927 | 8.4% | |
| 2010 | 24,512 | 6.9% | |
| Est. 2016 | 25,397 | [5] | 3.6% |
| U.S. Decennial Census[6] 1790-1960[7] 1900-1990[8] 1990-2000[9] 2010-2013[1] | |||
As of the census[10] of 2000, there were 22,927 people, 9,233 households, and 6,555 families residing in the county. The population density was 85 per square mile (33/km2). There were 10,180 housing units at an average density of 38 per square mile (15/km2). The racial makeup of the county was 93.62% White, 5.06% Black or African American, 0.10% Native American, 0.18% Asian, 0.02% Pacific Islander, 0.32% from other races, and 0.70% from two or more races. 0.82% of the population were Hispanic or Latino of any race.
There were 9,233 households out of which 30.90% had children under the age of 18 living with them, 56.40% were married couples living together, 11.50% had a female householder with no husband present, and 29.00% were non-families. 26.00% of all households were made up of individuals and 12.20% had someone living alone who was 65 years of age or older. The average household size was 2.41 and the average family size was 2.89.
In the county, the population was spread out with 23.40% under the age of 18, 10.40% from 18 to 24, 26.90% from 25 to 44, 24.10% from 45 to 64, and 15.20% who were 65 years of age or older. The median age was 38 years. For every 100 females, there were 92.70 males. For every 100 females age 18 and over, there were 88.70 males.
The median income for a household in the county was $28,089, and the median income for a family was $33,854. Males had a median income of $26,633 versus $20,480 for females. The per capita income for the county was $15,162. About 14.20% of families and 17.50% of the population were below the poverty line, including 23.70% of those under age 18 and 18.30% of those age 65 or over.
Communities
- Acton
- Bengal
- Black Gnat
- Campbellsville (county seat)
- Elk Horn
- Finley
- Hatcher
- Hobson
- Mannsville
- Merrimac
- Saloma
- Spurlington
- Yuma
Politics
Taylor County is represented in the Kentucky House of Representatives by Republican John "Bam" Carney.
| Year | Republican | Democratic | Third parties |
|---|---|---|---|
| 2016 | 73.6% 8,320 | 22.6% 2,553 | 3.8% 433 |
| 2012 | 69.0% 7,551 | 30.0% 3,285 | 1.0% 114 |
| 2008 | 69.7% 7,568 | 29.1% 3,165 | 1.2% 127 |
| 2004 | 70.4% 7,247 | 28.9% 2,979 | 0.7% 69 |
| 2000 | 68.0% 6,151 | 30.8% 2,790 | 1.2% 110 |
| 1996 | 54.9% 4,573 | 34.8% 2,897 | 10.4% 865 |
| 1992 | 48.4% 4,319 | 39.4% 3,518 | 12.1% 1,083 |
| 1988 | 64.8% 5,362 | 34.8% 2,879 | 0.5% 39 |
| 1984 | 64.2% 5,932 | 35.5% 3,286 | 0.3% 27 |
| 1980 | 54.6% 4,243 | 43.8% 3,400 | 1.6% 125 |
| 1976 | 48.6% 3,337 | 50.3% 3,456 | 1.1% 73 |
| 1972 | 67.8% 4,035 | 31.2% 1,859 | 1.0% 58 |
| 1968 | 50.9% 3,032 | 22.9% 1,367 | 26.2% 1,560 |
| 1964 | 45.4% 2,594 | 54.0% 3,082 | 0.6% 33 |
| 1960 | 68.1% 4,669 | 31.9% 2,186 | 0.0% 0 |
| 1956 | 61.4% 3,892 | 38.4% 2,433 | 0.3% 17 |
| 1952 | 55.9% 3,126 | 43.6% 2,439 | 0.5% 27 |
| 1948 | 44.8% 2,087 | 51.8% 2,415 | 3.4% 158 |
| 1944 | 51.1% 2,622 | 48.2% 2,475 | 0.8% 39 |
| 1940 | 49.8% 2,792 | 49.8% 2,790 | 0.4% 24 |
| 1936 | 49.9% 2,738 | 49.8% 2,732 | 0.4% 20 |
| 1932 | 47.5% 2,592 | 51.8% 2,823 | 0.7% 39 |
| 1928 | 65.1% 3,149 | 34.8% 1,684 | 0.2% 8 |
| 1924 | 52.1% 2,267 | 47.2% 2,052 | 0.8% 33 |
| 1920 | 50.9% 2,493 | 48.6% 2,380 | 0.5% 25 |
| 1916 | 49.0% 1,332 | 50.1% 1,360 | 0.9% 24 |
| 1912 | 18.9% 468 | 46.4% 1,150 | 34.8% 863 |
See also
References
- 1 2 "State & County QuickFacts". United States Census Bureau. Retrieved March 6, 2014.
- ↑ "Find a County". National Association of Counties. Retrieved 2011-06-07.
- ↑ The Register of the Kentucky State Historical Society, Volume 1. Kentucky State Historical Society. 1903. p. 37.
- ↑ "2010 Census Gazetteer Files". United States Census Bureau. August 22, 2012. Archived from the original on August 12, 2014. Retrieved August 20, 2014.
- ↑ "Population and Housing Unit Estimates". Retrieved June 9, 2017.
- ↑ "U.S. Decennial Census". United States Census Bureau. Retrieved August 20, 2014.
- ↑ "Historical Census Browser". University of Virginia Library. Retrieved August 20, 2014.
- ↑ "Population of Counties by Decennial Census: 1900 to 1990". United States Census Bureau. Retrieved August 20, 2014.
- ↑ "Census 2000 PHC-T-4. Ranking Tables for Counties: 1990 and 2000" (PDF). United States Census Bureau. Retrieved August 20, 2014.
- ↑ "American FactFinder". United States Census Bureau. Retrieved 2008-01-31.
- ↑ Leip, David. "Dave Leip's Atlas of U.S. Presidential Elections". uselectionatlas.org.
Municipalities and communities of Taylor County, Kentucky, United States | ||
|---|---|---|
| City | | |
| Unincorporated communities | ||