Graves County, Kentucky
| Graves County, Kentucky | |
|---|---|
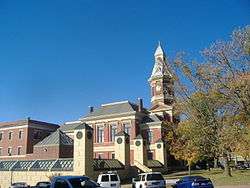 Graves County Courthouse in Mayfield | |
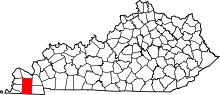 Location in the U.S. state of Kentucky | |
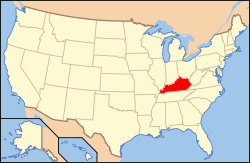 Kentucky's location in the U.S. | |
| Founded | 1824 |
| Named for | Benjamin F. Graves |
| Seat | Mayfield |
| Largest city | Mayfield |
| Area | |
| • Total | 557 sq mi (1,443 km2) |
| • Land | 552 sq mi (1,430 km2) |
| • Water | 5.0 sq mi (13 km2), 0.9% |
| Population | |
| • (2010) | 37,121 |
| • Density | 67/sq mi (26/km2) |
| Congressional district | 1st |
| Time zone | Central: UTC−6/−5 |
| Website |
www |
Graves County is a county located on the southwest border of the U.S. Commonwealth of Kentucky. As of the 2010 census, the population was 37,121.[1] Its county seat is Mayfield.[2] The county was formed in 1824 and was named for Major Benjamin Franklin Graves, a politician and fallen soldier in the War of 1812.
Graves County comprises the Mayfield, KY Micropolitan Statistical Area, which is included in the Paducah-Mayfield, KY-IL Combined Statistical Area.
Graves County is a "limited" dry county, meaning that sale of alcohol in the county is prohibited except for wine and beer in restaurants. In 2016, the county voted to become a "wet" county but that attempt failed. Later in the year, a ballot measure was proposed and passed within the city limits of Mayfield (the county seat) to allow alcohol sales in stores and gas stations.
History
Graves County was named for Capt. Benjamin Franklin Graves, who was one of numerous Kentucky officers killed after being taken as a prisoner in the disastrous 1813 Battle of Raisin River in Michigan Territory during the War of 1812. He disappeared while being forced by the Potawatomi, allies of the British, to walk to the British Fort Malden in Amherstburg, Ontario. The Indians killed prisoners who could not keep up.[3] Nearly 400 Kentuckians died in the January 22 battle, the highest fatality of any single battle during the war.
Graves is one of Kentucky's largest counties. The fertile land attracted early settlers from Virginia, North Carolina, South Carolina and Tennessee, who brought with them education, culture, and a fierce determination to succeed. They put down roots and created a unique political, economic, and social environment.
Tobacco was important to the local economy. Graves County developed the dark-fired and dark-air-cured leaf tobacco used in smokeless tobacco farming. In the early 20th century, Graves was one of the counties involved in the Black Patch Tobacco Wars, as white farmers organized in the western region to resist monopoly pricing by the American Tobacco Company. In 1908 the Kentucky governor sent state militia into the area to suppress violence, after tobacco warehouses and other properties, including tons of tobacco, were being destroyed.
A woolen mill began operating before the Civil War and continued to expand with the men's clothing market. Several clothing manufacturing companies were added in the area. The county seat's minor league baseball team was named the Mayfield Clothiers for this historical connection.
During the post-Reconstruction period, racial violence by whites against blacks continued in Graves County; they exercised terrorism to re-establish and maintain white supremacy. Whites lynched 6 African Americans here after 1877; most were killed around the turn of the 20th century.[4] Four were killed during one week in 1896 in Mayfield, the county seat. Three were killed on December 23 in the so-called Mayfield Race War. Whites had heard rumors that blacks were arming elsewhere in the county in retaliation for the lynching of Jim Stone earlier that week. The whites recruited reinforcements from Fulton County and, overly tense, killed Will Suett, a young black man, as he was getting off a train to visit his family for the holidays. Two other black men were fatally shot soon after.[5] Acknowledging that Suett's death was unprovoked, white residents took up a collection for his widowed mother.[6]
Like many other counties in Kentucky, Graves retained prohibition of the sale or consumption of alcohol, voting to be a "dry" county after Congress repealed Prohibition in the 20th century. Graves County was a "limited" dry county, meaning that sale of alcohol in the county is prohibited except for wine and beer in restaurants. In 2016, the county voted to become a "wet" county but that attempt failed. Later in the year, a ballot measure was proposed and passed within the city limits of Mayfield (the county seat) to allow alcohol sales in stores and gas stations.
Graves County made national news in September 2011 for jailing several Amish men who refused to use orange safety triangles on their buggies for religious reasons. The Old Order Swartzentruber Amish used reflective tape instead. They said it was against their religion to use "loud colors" (as they characterized the orange triangles). They did not succeed in their appeal of their 2008 convictions. Menno Zook, Danny Byler, Mose Yoder, Levi Hostetler, David Zook, and Eli Zook refused to pay the small fines imposed with their convictions. All served sentences ranging from three to 10 days. Jail officials accommodated them by not forcing them to wear the typical orange county jail uniforms; they allowed the Amish to wear dark gray uniforms.[7]
Among notable county natives have been a US Vice President, four US Congressmen, heroes, singers and songwriters, and noted writers. The county has numerous historic sites.
Geography
According to the U.S. Census Bureau, the county has a total area of 557 square miles (1,440 km2), of which 552 square miles (1,430 km2) is land and 5.0 square miles (13 km2) (0.9%) is water.[8]
Adjacent counties
- McCracken County (north)
- Marshall County (northeast)
- Calloway County (southeast)
- Henry County, Tennessee (southeast)
- Weakley County, Tennessee (south)
- Hickman County (southwest)
- Carlisle County (northwest)
National protected area
Demographics
| Historical population | |||
|---|---|---|---|
| Census | Pop. | %± | |
| 1830 | 2,504 | — | |
| 1840 | 7,465 | 198.1% | |
| 1850 | 11,397 | 52.7% | |
| 1860 | 16,233 | 42.4% | |
| 1870 | 19,398 | 19.5% | |
| 1880 | 24,138 | 24.4% | |
| 1890 | 28,534 | 18.2% | |
| 1900 | 33,204 | 16.4% | |
| 1910 | 33,539 | 1.0% | |
| 1920 | 32,483 | −3.1% | |
| 1930 | 30,778 | −5.2% | |
| 1940 | 31,763 | 3.2% | |
| 1950 | 31,364 | −1.3% | |
| 1960 | 30,021 | −4.3% | |
| 1970 | 30,939 | 3.1% | |
| 1980 | 34,049 | 10.1% | |
| 1990 | 33,550 | −1.5% | |
| 2000 | 37,028 | 10.4% | |
| 2010 | 37,121 | 0.3% | |
| Est. 2017 | 37,121 | [9] | 0.0% |
| U.S. Decennial Census[10] 1790-1960[11] 1900-1990[12] 1990-2000[13] 2010-2013[1] | |||
As of the census[14] of 2000, there were 37,028 people, 14,841 households, and 10,566 families residing in the county. The population density was 67 per square mile (26/km2). There were 16,340 housing units at an average density of 29 per square mile (11/km2). The racial makeup of the county was 92.73% White, 4.44% Black or African American, 0.20% Native American, 0.20% Asian, 0.01% Pacific Islander, 1.30% from other races, and 1.11% from two or more races. 2.40% of the population were Hispanic or Latino of any race.
There were 14,841 households out of which 31.50% had children under the age of 18 living with them, 57.90% were married couples living together, 10.00% had a female householder with no husband present, and 28.80% were non-families. 26.20% of all households were made up of individuals and 12.70% had someone living alone who was 65 years of age or older. The average household size was 2.44 and the average family size was 2.92.
In the county, the population was spread out with 24.50% under the age of 18, 8.30% from 18 to 24, 27.30% from 25 to 44, 23.80% from 45 to 64, and 16.10% who were 65 years of age or older. The median age was 38 years. For every 100 females there were 95.00 males. For every 100 females age 18 and over, there were 91.50 males.
The median income for a household in the county was $30,874, and the median income for a family was $38,054. Males had a median income of $32,016 versus $20,177 for females. The per capita income for the county was $16,834. About 13.10% of families and 16.40% of the population were below the poverty line, including 21.70% of those under age 18 and 14.10% of those age 65 or over.
Politics
| Year | Republican | Democratic | Third parties |
|---|---|---|---|
| 2016 | 76.3% 12,671 | 19.9% 3,308 | 3.8% 627 |
| 2012 | 69.0% 10,699 | 29.3% 4,547 | 1.7% 257 |
| 2008 | 62.3% 10,056 | 36.2% 5,843 | 1.6% 256 |
| 2004 | 61.0% 9,903 | 38.2% 6,206 | 0.7% 120 |
| 2000 | 55.2% 7,849 | 42.8% 6,097 | 2.0% 285 |
| 1996 | 37.2% 5,130 | 50.7% 6,991 | 12.2% 1,682 |
| 1992 | 34.6% 5,311 | 52.2% 8,001 | 13.2% 2,029 |
| 1988 | 46.3% 6,274 | 52.8% 7,153 | 0.9% 118 |
| 1984 | 51.4% 7,287 | 47.7% 6,759 | 0.9% 124 |
| 1980 | 47.5% 6,556 | 50.7% 6,999 | 1.9% 261 |
| 1976 | 25.7% 3,195 | 72.3% 8,982 | 2.0% 243 |
| 1972 | 60.4% 6,098 | 36.6% 3,701 | 3.0% 301 |
| 1968 | 26.5% 3,239 | 41.8% 5,103 | 31.7% 3,871 |
| 1964 | 19.3% 2,389 | 80.4% 9,958 | 0.4% 43 |
| 1960 | 38.7% 4,854 | 61.3% 7,689 | 0.0% 0 |
| 1956 | 26.9% 3,711 | 73.0% 10,090 | 0.1% 14 |
| 1952 | 23.3% 2,925 | 76.6% 9,592 | 0.1% 13 |
| 1948 | 13.8% 1,442 | 83.3% 8,682 | 2.9% 304 |
| 1944 | 21.2% 2,172 | 78.7% 8,057 | 0.1% 9 |
| 1940 | 17.8% 2,122 | 82.0% 9,786 | 0.2% 27 |
| 1936 | 15.3% 1,692 | 83.4% 9,231 | 1.3% 142 |
| 1932 | 15.5% 1,825 | 84.1% 9,888 | 0.4% 51 |
| 1928 | 34.0% 3,223 | 65.8% 6,237 | 0.3% 24 |
| 1924 | 23.2% 2,279 | 74.0% 7,266 | 2.7% 268 |
| 1920 | 25.9% 3,241 | 72.1% 9,018 | 1.9% 241 |
| 1916 | 26.5% 1,930 | 71.4% 5,197 | 2.0% 148 |
| 1912 | 15.2% 862 | 67.9% 3,838 | 16.9% 957 |
Communities
Cities
- Mayfield (county seat)
- Water Valley
- Wingo
Census-designated places
Other unincorporated communities
- Bell City
- Boaz
- Clear Springs
- Cuba
- Dogwood
- Dublin
- Dukedom (partial)
- Fairbanks
- Feliciana
- Folsomdale
- Golo
- Kaler
- Kansas
- Lynnville
- Melber (partial)
- Natchez Trace
- Pilot Oak
- Pottsville
- South Highland
- Stubblefield
- Tri City
- Viola
- West Viola
- Westplains
- Wheel
Notable residents
- Lucien Anderson – U.S. Representative
- Alben W. Barkley – U.S. Representative, Senator, and Vice President
- Lon Carter Barton – Historian, state representative
- Andrew Boone – U.S. Representative
- Herschel Green – World War II flying ace in the United States Army Air Forces
- Noble Jones Gregory – U.S. Representative
- William Voris Gregory – U.S. Representative
- Carroll Hubbard – U.S. Representative
- John Paul Hogan
- Bobbie Ann Mason – author
- Kevin Skinner – country singer and reality show winner
- Adrian Smith – former NBA player
- Jimmy Work – songwriter
See also
References
- 1 2 "State & County QuickFacts". United States Census Bureau. Archived from the original on July 11, 2011. Retrieved March 6, 2014.
- ↑ "Find a County". National Association of Counties. Archived from the original on May 31, 2011. Retrieved June 7, 2011.
- ↑ The Register of the Kentucky State Historical Society, Volume 1. Kentucky State Historical Society. 1903. p. 35.
- ↑ Lynching in America/ Supplement: Lynchings by County, 3rd Edition, 2015, p.5
- ↑ "Race War in Mayfield, KY", NKAA: Notable Kentucky African Americans Database, 2003-2018, University of Kentucky Libraries; accessed 25 March 2018
- ↑ "Peace Reigns at Mayfield", New York Times, 25 December 1896; accessed 25 March 2018
- ↑ "Amish men jailed over refusal to use orange safety triangle on buggies". CNN. September 14, 2011.
- ↑ "2010 Census Gazetteer Files". United States Census Bureau. August 22, 2012. Archived from the original on August 12, 2014. Retrieved August 14, 2014.
- ↑ "Population and Housing Unit Estimates". Retrieved June 9, 2017.
- ↑ "U.S. Decennial Census". United States Census Bureau. Archived from the original on May 12, 2015. Retrieved August 14, 2014.
- ↑ "Historical Census Browser". University of Virginia Library. Retrieved August 14, 2014.
- ↑ "Population of Counties by Decennial Census: 1900 to 1990". United States Census Bureau. Retrieved August 14, 2014.
- ↑ "Census 2000 PHC-T-4. Ranking Tables for Counties: 1990 and 2000" (PDF). United States Census Bureau. Retrieved August 14, 2014.
- ↑ "American FactFinder". United States Census Bureau. Archived from the original on September 11, 2013. Retrieved January 31, 2008.
- ↑ Leip, David. "Dave Leip's Atlas of U.S. Presidential Elections". uselectionatlas.org. Retrieved 2018-07-01.
External links
- Graves County Schools
- Mayfield and Graves County Chamber of Commerce and Tourism
- Graves County Cluster of United Methodist Churches
- Mayfield Graves County Airport
- www.gravescountyky.com/
Municipalities and communities of Graves County, Kentucky, United States | ||
|---|---|---|
| Cities | | |
| CDPs | ||
| Unincorporated communities | ||
| Footnotes | ‡This populated place also has portions in an adjacent county or counties | |