United States presidential election in Colorado, 2012
|
| ||||||||||||||||||||||||||
| ||||||||||||||||||||||||||
| Turnout |
71.1% | |||||||||||||||||||||||||
|---|---|---|---|---|---|---|---|---|---|---|---|---|---|---|---|---|---|---|---|---|---|---|---|---|---|---|
| ||||||||||||||||||||||||||
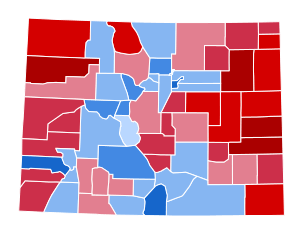 County Results
| ||||||||||||||||||||||||||
| ||||||||||||||||||||||||||
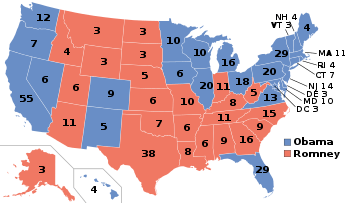
The 2012 United States presidential election in Colorado took place on November 6, 2012, as part of the 2012 General Election in which all 50 states plus The District of Columbia participated. Colorado voters chose 9 electors to represent them in the Electoral College via a popular vote pitting incumbent Democratic President Barack Obama and his running mate, Vice President Joe Biden, against Republican challenger and former Massachusetts Governor Mitt Romney and his running mate, Congressman Paul Ryan. Obama and Biden carried Colorado with 51.5% of the popular vote to Romney's and Ryan's 46.1%, thus winning the state's 9 electoral votes.[2]
As in 2008, the key to Obama's victory was Democratic dominance in the Denver area, sweeping not just the city but also the heavily populated suburban counties around Denver, particularly Adams, Arapahoe, and Jefferson counties, as well as winning Larimer County, home to Fort Collins. Obama also took nearly 70% of the vote in Boulder County, home to Boulder, and won Chaffee County, which he had lost to McCain in 2008. Romney's most populated county wins were in El Paso County, where Colorado Springs is located, and Weld County.
This election solidified Colorado's transformation from a historically Republican-leaning state into a Democratic-leaning swing state. Obama's 2012 victory in the state, on the heels of his 2008 victory, marked the first time that the Democrats had carried Colorado in two consecutive elections since the landslide re-election of Franklin Roosevelt in 1936.
General election
Candidate Ballot Access:
- Virgil Goode/Jim Clymer, Constitution
- Barack Obama/Joseph Biden, Democratic
- Mitt Romney/Paul Ryan, Republican
- Gary Johnson/James P. Gray, Libertarian
- Jill Stein/Cheri Honkala, Green
- Stewart Alexander/Alex Mendoza, Socialist
- Rocky Anderson/Luis J. Rodriguez, Justice
- Roseanne Barr/Cindy Shehan, Peace and Freedom
- James Harris/Alyson Kennedy, Socialist Workers
- Tom Hoefling/J.D. Ellis, America's
- Gloria La Riva/Filberto Ramirez Jr., Socialism and Liberation
- Merlin Miller/Harry V. Bertram, American Third Position
- Jill Reed/Tom Cary, Twelve Visions Party
- Thomas Robert Stevens/Alden Link, Objectivist
- Shella "Samm" Tittle/Matthew A. Turner, We the People
- Jerry White/Phyllis Scherrer, Socialist Equality
Results
| United States presidential election in Colorado, 2012 | ||||||
|---|---|---|---|---|---|---|
| Party | Candidate | Running mate | Votes | Percentage | Electoral votes | |
| Democratic | Barack Obama | Joe Biden | 1,323,101 | 51.49% | 9 | |
| Republican | Mitt Romney | Paul Ryan | 1,185,243 | 46.13% | 0 | |
| Libertarian | Gary Johnson | Jim Gray | 35,545 | 1.38% | 0 | |
| Green | Jill Stein | Cheri Honkala | 7,508 | 0.29% | 0 | |
| Constitution | Virgil Goode | Jim Clymer | 6,234 | 0.24% | 0 | |
| Peace & Freedom | Roseanne Barr | Cindy Sheehan | 5,059 | 0.20% | 0 | |
| Unaffiliated | Jill Ann Reed | Tom Cary | 2,589 | 0.10% | 0 | |
| Justice | Rocky Anderson | Luis J. Rodriguez | 1,260 | 0.05% | 0 | |
| Others | Others | 1,028 | 0.04% | 0 | ||
| America's Party | Thomas Hoefling | Jonathan D. Ellis | 679 | 0.03% | 0 | |
| Socialism and Liberation | Gloria La Riva | Filberto Ramirez Jr. | 317 | 0.01% | 0 | |
| Socialist | Stewart Alexander | Alex Mendoza | 308 | 0.01% | 0 | |
| American Third Position | Merlin Miller | Harry Bertram | 266 | 0.01% | 0 | |
| Socialist Workers | James Harris | Alyson Kennedy | 192 | 0.01% | 0 | |
| Socialist Equality | Jerry White | Phyllis Scherrer | 189 | 0.01% | 0 | |
| Totals | 2,569,518 | 100.00% | 9 | |||
By county
| County | Obama% | Obama# | Romney% | Romney# | Others% | Others# | Total |
|---|---|---|---|---|---|---|---|
| Adams County | 57.30% | 100,649 | 40.40% | 70,972 | 02.30% | 4,039 | 175,660 |
| Alamosa County | 57.03% | 3,811 | 40.48% | 2,705 | 02.50% | 167 | 6,683 |
| Arapahoe County | 54.03% | 153,905 | 44.09% | 125,588 | 01.88% | 5,368 | 284,861 |
| Archuleta County | 39.92% | 2,679 | 57.70% | 3,872 | 02.38% | 160 | 6,711 |
| Baca County | 22.38% | 467 | 74.70% | 1,559 | 02.92% | 61 | 2,087 |
| Bent County | 42.16% | 815 | 55.61% | 1,075 | 02.22% | 43 | 1,933 |
| Boulder County | 69.79% | 125,091 | 27.89% | 49,981 | 02.32% | 4,165 | 179,237 |
| Broomfield | 51.88% | 16,966 | 45.90% | 15,008 | 02.22% | 726 | 32,700 |
| Chaffee County | 48.77% | 5,086 | 48.62% | 5,070 | 02.61% | 272 | 10,428 |
| Cheyenne County | 15.82% | 172 | 81.78% | 889 | 02.39% | 26 | 1,087 |
| Clear Creek County | 54.44% | 3,119 | 42.42% | 2,430 | 03.14% | 180 | 5,729 |
| Conejos County | 54.11% | 2,213 | 44.87% | 1,835 | 01.03% | 42 | 4,090 |
| Costilla County | 73.67% | 1,340 | 24.52% | 446 | 01.81% | 33 | 1,819 |
| Crowley County | 35.81% | 535 | 61.85% | 924 | 02.34% | 35 | 1,494 |
| Custer County | 32.08% | 868 | 66.08% | 1,788 | 01.85% | 50 | 2,706 |
| Delta County | 29.13% | 4,622 | 68.79% | 10,915 | 02.07% | 329 | 15,866 |
| Denver | 73.69% | 222,018 | 24.27% | 73,111 | 02.04% | 6,158 | 301,287 |
| Dolores County | 26.98% | 334 | 69.39% | 859 | 03.63% | 45 | 1,238 |
| Douglas County | 36.40% | 61,094 | 62.20% | 104,397 | 01.40% | 2,357 | 167,848 |
| Eagle County | 56.49% | 12,792 | 41.56% | 9,411 | 01.95% | 441 | 22,644 |
| El Paso County | 38.64% | 111,819 | 59.08% | 170,952 | 02.28% | 6,585 | 289,356 |
| Elbert County | 25.49% | 3,603 | 72.63% | 10,266 | 01.88% | 266 | 14,135 |
| Fremont County | 32.98% | 6,704 | 64.81% | 13,174 | 02.21% | 449 | 20,327 |
| Garfield County | 46.42% | 11,305 | 51.47% | 12,535 | 02.11% | 513 | 24,353 |
| Gilpin County | 56.82% | 1,892 | 40.42% | 1,346 | 02.76% | 92 | 3,330 |
| Grand County | 45.14% | 3,684 | 52.11% | 4,253 | 02.74% | 224 | 8,161 |
| Gunnison County | 58.35% | 5,044 | 38.65% | 3,341 | 03.00% | 259 | 8,644 |
| Hinsdale County | 38.42% | 229 | 59.23% | 353 | 02.35% | 14 | 596 |
| Huerfano County | 52.78% | 1,953 | 44.49% | 1,646 | 02.73% | 101 | 3,700 |
| Jackson County | 25.62% | 216 | 71.17% | 600 | 03.20% | 27 | 843 |
| Jefferson County | 51.31% | 159,296 | 46.45% | 144,197 | 02.23% | 6,937 | 310,430 |
| Kiowa County | 14.43% | 118 | 82.76% | 677 | 02.81% | 23 | 818 |
| Kit Carson County | 22.72% | 838 | 75.49% | 2,785 | 01.79% | 66 | 3,689 |
| La Plata County | 53.18% | 15,489 | 43.92% | 12,794 | 02.90% | 845 | 29,128 |
| Lake County | 60.81% | 1,839 | 36.31% | 1,098 | 02.88% | 87 | 3,024 |
| Larimer County | 51.61% | 92,747 | 45.84% | 82,376 | 02.55% | 4,584 | 179,707 |
| Las Animas County | 50.32% | 3,445 | 47.66% | 3,263 | 02.02% | 138 | 6,846 |
| Lincoln County | 24.23% | 552 | 74.06% | 1,687 | 01.71% | 39 | 2,278 |
| Logan County | 29.87% | 2,712 | 68.06% | 6,179 | 02.07% | 188 | 9,079 |
| Mesa County | 32.78% | 23,846 | 65.25% | 47,472 | 01.97% | 1,432 | 72,750 |
| Mineral County | 44.84% | 291 | 53.00% | 344 | 02.16% | 14 | 649 |
| Moffat County | 21.65% | 1,330 | 76.43% | 4,695 | 01.92% | 118 | 6,143 |
| Montezuma County | 36.97% | 4,542 | 60.24% | 7,401 | 02.78% | 342 | 12,285 |
| Montrose County | 30.61% | 6,138 | 67.58% | 13,552 | 01.82% | 364 | 20,054 |
| Morgan County | 36.47% | 3,912 | 61.55% | 6,602 | 01.98% | 212 | 10,726 |
| Otero County | 44.73% | 3,647 | 53.74% | 4,382 | 01.53% | 125 | 8,154 |
| Ouray County | 51.58% | 1,646 | 46.41% | 1,481 | 02.01% | 64 | 3,191 |
| Park County | 41.46% | 3,862 | 56.20% | 5,236 | 02.34% | 218 | 9,316 |
| Phillips County | 26.01% | 588 | 72.40% | 1,637 | 01.59% | 36 | 2,261 |
| Pitkin County | 68.03% | 6,849 | 30.04% | 3,024 | 01.94% | 195 | 10,068 |
| Prowers County | 31.32% | 1,519 | 66.60% | 3,230 | 02.08% | 101 | 4,850 |
| Pueblo County | 56.02% | 42,551 | 41.99% | 31,894 | 01.98% | 1,506 | 75,951 |
| Rio Blanco County | 16.94% | 568 | 81.22% | 2,724 | 01.85% | 62 | 3,354 |
| Rio Grande County | 45.00% | 2,478 | 52.99% | 2,918 | 02.02% | 111 | 5,507 |
| Routt County | 56.75% | 7,547 | 41.13% | 5,469 | 02.12% | 282 | 13,298 |
| Saguache County | 63.83% | 1,865 | 32.99% | 964 | 03.18% | 93 | 2,922 |
| San Juan County | 52.88% | 266 | 42.15% | 212 | 04.97% | 25 | 503 |
| San Miguel County | 70.50% | 2,992 | 27.19% | 1,154 | 02.31% | 98 | 4,244 |
| Sedgwick County | 31.46% | 419 | 66.14% | 881 | 02.40% | 32 | 1,332 |
| Summit County | 61.14% | 9,347 | 36.44% | 5,571 | 02.41% | 369 | 15,287 |
| Teller County | 32.42% | 4,333 | 65.12% | 8,702 | 02.46% | 329 | 13,364 |
| Washington County | 18.13% | 468 | 80.43% | 2,076 | 01.43% | 37 | 2,581 |
| Weld County | 42.51% | 49,050 | 55.27% | 63,775 | 02.22% | 2,558 | 115,383 |
| Yuma County | 21.65% | 987 | 76.55% | 3,490 | 01.80% | 82 | 4,559 |
Democratic caucuses
In 2012, Barack Obama ran unopposed in the Colorado Democratic caucus.
Republican caucuses
|
| |||||||||||||||||||||||||||||||||||||||||
| |||||||||||||||||||||||||||||||||||||||||
| |||||||||||||||||||||||||||||||||||||||||
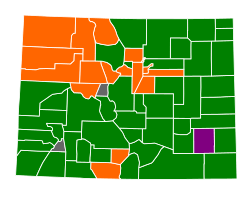 Colorado results by county
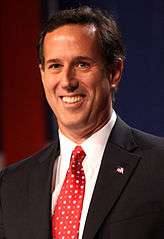
Rick Santorum
Mitt Romney
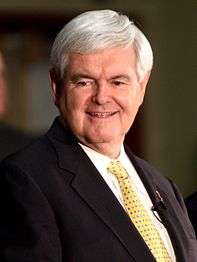
Newt Gingrich
Tie | |||||||||||||||||||||||||||||||||||||||||

| Elections in Colorado | ||||||||
|---|---|---|---|---|---|---|---|---|
 | ||||||||
|
||||||||
|
|
||||||||
|
|
||||||||
Part of a series on the 2012 U.S. presidential election |
|---|
| Democratic Party |
| Republican Party |
| Related races |
The Republican caucuses were held on "Republican Party Precinct Caucus Day" (February 7, 2012).[3] Caucus locations opened on 9 PM, February 7, 2012,[4] with 36 delegates at stake; 33 of which are tied to the caucuses while 3 are unpledged RNC delegates.[5] The event occurred alongside the Minnesota Republican caucuses as well the Missouri Republican primary. The race was widely expected to be won by Mitt Romney even on the day of the caucus, but a strong surge by Rick Santorum across all three races that day carried him to a close victory.
Results with 100% (2,917 of 2,917 precincts) reporting:
| Colorado Republican caucus, February 7, 2012[6] | ||||||||
|---|---|---|---|---|---|---|---|---|
| Candidate | Votes | Percentage | Projected delegate count | Convention Results [7][8] | ||||
| MSNBC [9] |
GP [10] | |||||||
| Rick Santorum | 26,614 | 40.31% | 6 | 6 | 6 | |||
| 23,012 | 34.85% | 13 | 14 | 13 | ||||
| Newt Gingrich | 8,445 | 12.79% | 0 | 0 | 0 | |||
| Ron Paul | 7,759 | 11.75% | 3 | 0 | 0 | |||
| Rick Perry | 52 | 0.08% | 0 | 0 | 0 | |||
| Jon Huntsman | 46 | 0.07% | 0 | 0 | 0 | |||
| Michele Bachmann | 28 | 0.04% | 0 | 0 | 0 | |||
| Others | 71 | 0.11% | 0 | 0 | 0 | |||
| Unprojected delegates: | 14 | 0 | 0 | |||||
| Unpledged delegates: | 0 | 16 | 17 | |||||
| Totals: | 66,027 | 100.00% | 36 | 36 | 36 | |||
| Key: | Withdrew prior to contest |
Conventions
There is no formal system of allocating delegates to candidates in any step of the election process. At each meeting the participants decides what the best course of action is.
None of the 36 delegates are legally bound to vote for a candidate.
- 12–13 April: Seven congressional conventions elects 3 National Convention delegates each and also elects delegates for the state convention.
- 14 April: State convention elects 12 National Convention delegates.
| Convention Results[7][11] | ||||||||||
|---|---|---|---|---|---|---|---|---|---|---|
| Candidate | 1st | 2nd | 3rd | 4th | 5th | 6th | 7th | State | Party leaders | Total |
| 2 | 2 | 2 | 2 | 0 | 1 | 1 | 4 | 3 | 17 | |
| Mitt Romney | 0 | 0 | 1 | 0 | 1 | 2 | 1 | 8 | 0 | 13 |
| Rick Santorum | 1 | 1 | 0 | 1 | 2 | 0 | 1 | 0 | 0 | 6 |
| Total | 21 | 12 | 3 | 36 | ||||||
See also
References
- ↑ "US Voting 2012" (PDF). nonprofitvote.org. Retrieved 23 July 2017.
- ↑ "2012 General Election". Colorado Department of State. Retrieved 22 November 2012.
- ↑ "Archived copy" (PDF). Archived from the original (PDF) on 2011-11-10. Retrieved 2011-08-16.
- ↑ "Colorado GOP moves up 2012 caucuses to Feb. 7". Denver Post. Associated Press. September 24, 2011. Retrieved October 3, 2011.
- ↑ "Republican Delegate Allocation". The Green Papers. Retrieved 2011-12-03.
- ↑ "2012 Colorado GOP Presidential Caucus Results". Colorado Republican Party.
- 1 2 "National Delegate Results". cologop.org. Colorado Republican Party. Retrieved 23 April 2012.
- ↑ The Republic,CO GOP Assembly Archived 2012-04-18 at the Wayback Machine. (April 22, 2012)
- ↑ "Republican Caucuses Archived 2012-05-08 at the Wayback Machine." (May 7, 2012). MSNBC.
- ↑ "Republican Caucus"
- ↑ Bartels, Lynn (14 April 2012). "Colorado Republicans split delegate votes between Romney, unified Paul and Santorum supporters". denverpost.com. Denver Post. Retrieved 23 April 2012.
External links
- Official website of the Colorado Republican Party
- The Green Papers: for Colorado
- The Green Papers: Major state elections in chronological order
State results of the 2012 U.S. presidential election | ||
|---|---|---|
|  | |
| ||