United States presidential election in Tennessee, 2012
|
| ||||||||||||||||||||||||||
| ||||||||||||||||||||||||||
| ||||||||||||||||||||||||||
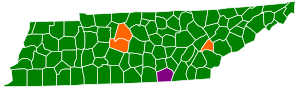
 County Results
| ||||||||||||||||||||||||||
| ||||||||||||||||||||||||||
| Elections in Tennessee |
|---|
 |
|
|
Part of a series on the 2012 U.S. presidential election |
|---|
| Democratic Party |
| Republican Party |
| Related races |
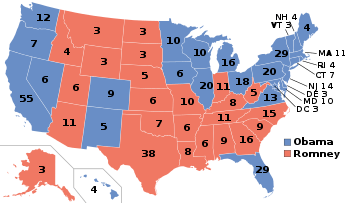
The 2012 United States presidential election in Tennessee took place on November 6, 2012, as part of the 2012 General Election in which all 50 states plus The District of Columbia participated. Tennessee voters chose 11 electors to represent them in the Electoral College via a popular vote pitting incumbent Democratic President Barack Obama and his running mate, Vice President Joe Biden, against Republican challenger and former Massachusetts Governor Mitt Romney and his running mate, Congressman Paul Ryan.
Mitt Romney received Tennessee's 11 electoral votes after he garnered 59.48% of the popular vote in Tennessee, to Barack Obama's 39.08%.[1]
Much like in previous elections, larger metropolitan areas such as Memphis and Nashville were won by the Democratic Party, but rural areas overwhelmingly favored the Republican Party. Barack Obama proved especially unpopular among the state's conservative electorate; consequently, Mitt Romney's 20.4% margin of victory was the strongest Republican win in Tennessee since 1972. Tennessee has not voted for a Democratic candidate since 1996. This is the most recent election in which Hardeman County was won by the Democratic candidate as of 2016.
General Election
Results
| United States presidential election in Tennessee, 2012 | ||||||
|---|---|---|---|---|---|---|
| Party | Candidate | Running mate | Votes | Percentage | Electoral votes | |
| Republican | Mitt Romney | Paul Ryan | 1,462,330 | 59.48% | 11 | |
| Democratic | Barack Obama | Joe Biden | 960,709 | 39.08% | 0 | |
| Libertarian | Gary Johnson | Jim Gray | 18,623 | 0.67% | 0 | |
| Green | Jill Stein | Cheri Honkala | 6,515 | 0.26% | 0 | |
| Constitution | Virgil Goode | Jim Clymer | 6,022 | 0.24% | 0 | |
| Justice | Rocky Anderson | Luis J. Rodriguez | 2,639 | 0.11% | 0 | |
| American Third Position | Merlin Miller | Virginia D. Abernethy | 1,739 | 0.07% | 0 | |
| Totals | 2,458,577 | 100.00% | 11 | |||
By congressional district
Mitt Romney swept the state and carried seven of the state's nine congressional districts, all represented by Republicans. Barack Obama carried the state's two congressional districts anchored by the two largest cities of Memphis and Nashville.[2]
| District | Romney | Obama | Representative |
|---|---|---|---|
| 1st | 72.7% | 25.7% | |
| Phil Roe | |||
| 2nd | 67.3% | 30.9% | John J. Duncan, Jr. |
| 3rd | 63.3% | 35.1% | Chuck Fleischmann |
| 4th | 65.3% | 33.1% | Scott DesJarlais |
| 5th | 42.5% | 55.9% | Jim Cooper |
| 6th | 69.1% | 29.5% | Diane Black |
| 7th | 65.7% | 32.9% | Marsha Blackburn |
| 8th | 66.1% | 32.8% | Stephen Fincher |
| 9th | 20.9% | 78.3% | Steve Cohen |
By county
| County | Obama% | Obama# | Romney% | Romney# | Others% | Others# | Total |
|---|---|---|---|---|---|---|---|
| Anderson County | 34.13% | 10,122 | 63.95% | 18,968 | 01.92% | 569 | 29,659 |
| Bedford County | 29.15% | 4,211 | 69.46% | 10,034 | 01.38% | 200 | 14,445 |
| Benton County | 36.27% | 2,258 | 61.84% | 3,850 | 01.90% | 118 | 6,226 |
| Bledsoe County | 29.07% | 1,267 | 69.33% | 3,022 | 01.61% | 70 | 4,359 |
| Blount County | 26.27% | 12,934 | 71.98% | 35,441 | 01.74% | 859 | 49,234 |
| Bradley County | 22.35% | 8,037 | 76.25% | 27,422 | 01.40% | 504 | 35,963 |
| Campbell County | 27.50% | 3,328 | 71.10% | 8,604 | 01.40% | 169 | 12,101 |
| Cannon County | 31.45% | 1,564 | 66.54% | 3,309 | 02.01% | 100 | 4,973 |
| Carroll County | 32.02% | 3,475 | 66.58% | 7,225 | 01.39% | 151 | 10,851 |
| Carter County | 23.23% | 4,789 | 75.20% | 15,503 | 01.58% | 325 | 20,617 |
| Cheatham County | 30.69% | 4,659 | 67.63% | 10,268 | 01.68% | 255 | 15,182 |
| Chester County | 25.34% | 1,624 | 73.07% | 4,684 | 01.59% | 102 | 6,410 |
| Claiborne County | 23.90% | 2,433 | 74.84% | 7,617 | 01.26% | 128 | 10,178 |
| Clay County | 36.77% | 1,037 | 61.95% | 1,747 | 01.28% | 36 | 2,820 |
| Cocke County | 24.48% | 2,804 | 73.85% | 8,459 | 01.67% | 191 | 11,454 |
| Coffee County | 30.48% | 5,870 | 67.62% | 13,023 | 01.90% | 366 | 19,259 |
| Crockett County | 30.36% | 1,669 | 68.81% | 3,783 | 00.84% | 46 | 5,498 |
| Cumberland County | 24.80% | 6,261 | 73.88% | 18,653 | 01.32% | 333 | 25,247 |
| Davidson County | 58.45% | 143,120 | 39.87% | 97,622 | 01.69% | 4,131 | 244,873 |
| Decatur County | 30.65% | 1,303 | 67.61% | 2,874 | 01.74% | 74 | 4,251 |
| DeKalb County | 33.85% | 2,174 | 64.51% | 4,143 | 01.64% | 105 | 6,422 |
| Dickson County | 34.95% | 6,233 | 63.34% | 11,296 | 01.72% | 306 | 17,835 |
| Dyer County | 27.22% | 3,757 | 71.89% | 9,921 | 00.88% | 122 | 13,800 |
| Fayette County | 34.17% | 6,688 | 64.83% | 12,689 | 01.01% | 197 | 19,574 |
| Fentress County | 22.64% | 1,561 | 76.04% | 5,243 | 01.32% | 91 | 6,895 |
| Franklin County | 34.76% | 5,603 | 63.66% | 10,262 | 01.58% | 254 | 16,119 |
| Gibson County | 33.38% | 6,564 | 65.51% | 12,883 | 01.12% | 220 | 19,667 |
| Giles County | 34.82% | 3,760 | 64.03% | 6,915 | 01.15% | 124 | 10,799 |
| Grainger County | 23.00% | 1,668 | 75.43% | 5,470 | 01.57% | 114 | 7,252 |
| Greene County | 26.06% | 6,225 | 72.19% | 17,245 | 01.75% | 417 | 23,887 |
| Grundy County | 38.78% | 1,643 | 59.38% | 2,516 | 01.84% | 78 | 4,237 |
| Hamblen County | 26.13% | 5,234 | 72.49% | 14,522 | 01.38% | 276 | 20,032 |
| Hamilton County | 41.67% | 58,836 | 56.62% | 79,933 | 01.71% | 2,412 | 141,181 |
| Hancock County | 23.22% | 475 | 74.63% | 1,527 | 02.15% | 44 | 2,046 |
| Hardeman County | 52.51% | 5,482 | 46.60% | 4,865 | 00.88% | 92 | 10,439 |
| Hardin County | 23.51% | 2,467 | 75.14% | 7,886 | 01.35% | 142 | 10,495 |
| Hawkins County | 25.70% | 5,088 | 72.65% | 14,382 | 01.65% | 327 | 19,797 |
| Haywood County | 60.36% | 4,569 | 39.11% | 2,960 | 00.53% | 40 | 7,569 |
| Henderson County | 25.03% | 2,517 | 73.80% | 7,421 | 01.16% | 117 | 10,055 |
| Henry County | 34.06% | 4,339 | 64.31% | 8,193 | 01.62% | 207 | 12,739 |
| Hickman County | 35.49% | 2,698 | 62.59% | 4,758 | 01.92% | 146 | 7,602 |
| Houston County | 46.25% | 1,400 | 52.16% | 1,579 | 01.59% | 48 | 3,027 |
| Humphreys County | 42.33% | 2,905 | 55.85% | 3,833 | 01.82% | 125 | 6,863 |
| Jackson County | 41.56% | 1,739 | 56.96% | 2,383 | 01.48% | 62 | 4,184 |
| Jefferson County | 24.10% | 4,232 | 74.25% | 13,038 | 01.65% | 289 | 17,559 |
| Johnson County | 23.94% | 1,483 | 74.44% | 4,611 | 01.61% | 100 | 6,194 |
| Knox County | 34.43% | 59,399 | 63.60% | 109,707 | 01.97% | 3,401 | 172,507 |
| Lake County | 42.36% | 884 | 55.73% | 1,163 | 01.92% | 40 | 2,087 |
| Lauderdale County | 46.16% | 4,011 | 53.12% | 4,616 | 00.71% | 62 | 8,689 |
| Lawrence County | 27.84% | 4,237 | 70.77% | 10,770 | 01.39% | 212 | 15,219 |
| Lewis County | 30.83% | 1,447 | 66.40% | 3,117 | 02.77% | 130 | 4,694 |
| Lincoln County | 24.80% | 3,290 | 73.88% | 9,803 | 01.32% | 175 | 13,268 |
| Loudon County | 22.91% | 5,058 | 75.69% | 16,707 | 01.40% | 308 | 22,073 |
| Macon County | 22.48% | 1,552 | 76.18% | 5,260 | 01.35% | 93 | 6,905 |
| Madison County | 45.13% | 18,367 | 54.03% | 21,993 | 00.84% | 342 | 40,702 |
| Marion County | 37.98% | 3,953 | 60.26% | 6,272 | 01.77% | 184 | 10,409 |
| Marshall County | 34.68% | 3,725 | 63.61% | 6,832 | 01.71% | 184 | 10,741 |
| Maury County | 35.83% | 11,825 | 62.74% | 20,708 | 01.43% | 473 | 33,006 |
| McMinn County | 25.84% | 4,609 | 72.71% | 12,967 | 01.45% | 258 | 17,834 |
| McNairy County | 26.98% | 2,645 | 71.57% | 7,015 | 01.45% | 142 | 9,802 |
| Meigs County | 29.34% | 1,163 | 68.97% | 2,734 | 01.69% | 67 | 3,964 |
| Monroe County | 26.76% | 4,372 | 71.80% | 11,731 | 01.44% | 235 | 16,338 |
| Montgomery County | 44.08% | 24,499 | 54.41% | 30,245 | 01.51% | 840 | 55,584 |
| Moore County | 25.19% | 705 | 73.35% | 2,053 | 01.46% | 41 | 2,799 |
| Morgan County | 26.52% | 1,725 | 71.79% | 4,669 | 01.69% | 110 | 6,504 |
| Obion County | 27.01% | 3,321 | 71.68% | 8,814 | 01.32% | 162 | 12,297 |
| Overton County | 36.60% | 2,805 | 62.30% | 4,775 | 01.10% | 84 | 7,664 |
| Perry County | 37.85% | 992 | 60.21% | 1,578 | 01.95% | 51 | 2,621 |
| Pickett County | 29.03% | 712 | 69.79% | 1,712 | 01.18% | 29 | 2,453 |
| Polk County | 30.63% | 1,856 | 67.80% | 4,108 | 01.57% | 95 | 6,059 |
| Putnam County | 30.60% | 7,802 | 67.66% | 17,254 | 01.74% | 444 | 25,500 |
| Rhea County | 24.82% | 2,628 | 73.67% | 7,802 | 01.51% | 160 | 10,590 |
| Roane County | 28.53% | 6,018 | 69.82% | 14,724 | 01.65% | 348 | 21,090 |
| Robertson County | 31.53% | 8,290 | 67.11% | 17,643 | 01.35% | 356 | 26,289 |
| Rutherford County | 36.84% | 36,414 | 61.56% | 60,846 | 01.61% | 1,588 | 98,848 |
| Scott County | 21.78% | 1,452 | 76.74% | 5,117 | 01.48% | 99 | 6,668 |
| Sequatchie County | 28.96% | 1,489 | 68.86% | 3,541 | 02.18% | 112 | 5,142 |
| Sevier County | 21.91% | 7,418 | 76.73% | 25,984 | 01.36% | 462 | 33,864 |
| Shelby County | 62.63% | 232,443 | 36.55% | 135,649 | 00.81% | 3,017 | 371,109 |
| Smith County | 34.85% | 2,470 | 63.43% | 4,495 | 01.72% | 122 | 7,087 |
| Stewart County | 40.45% | 2,069 | 57.93% | 2,963 | 01.62% | 83 | 5,115 |
| Sullivan County | 25.58% | 15,321 | 72.74% | 43,562 | 01.68% | 1,004 | 59,887 |
| Sumner County | 28.42% | 18,579 | 70.38% | 46,003 | 01.20% | 784 | 65,366 |
| Tipton County | 29.62% | 7,133 | 69.23% | 16,672 | 01.15% | 276 | 24,081 |
| Trousdale County | 42.69% | 1,240 | 55.49% | 1,612 | 01.82% | 53 | 2,905 |
| Unicoi County | 27.00% | 1,913 | 71.01% | 5,032 | 01.99% | 141 | 7,086 |
| Union County | 25.36% | 1,478 | 73.47% | 4,282 | 01.17% | 68 | 5,828 |
| Van Buren County | 38.04% | 875 | 60.26% | 1,386 | 01.70% | 39 | 2,300 |
| Warren County | 36.51% | 4,752 | 61.54% | 8,010 | 01.94% | 253 | 13,015 |
| Washington County | 29.82% | 14,325 | 68.30% | 32,808 | 01.87% | 899 | 48,032 |
| Wayne County | 21.20% | 1,163 | 77.52% | 4,253 | 01.28% | 70 | 5,486 |
| Weakley County | 28.76% | 3,548 | 69.75% | 8,605 | 01.49% | 184 | 12,337 |
| White County | 30.58% | 2,795 | 67.80% | 6,197 | 01.62% | 148 | 9,140 |
| Williamson County | 26.13% | 25,142 | 72.59% | 69,850 | 01.28% | 1,233 | 96,225 |
| Wilson County | 28.53% | 14,695 | 70.12% | 36,109 | 01.35% | 695 | 51,499 |
History
In previous elections, Tennessee was typically won by the Republican party, with Republicans winning in Tennessee for the past three election cycles, since the 2000 election.[3]
Democratic primary
|
| |||||||||||||||||||
| |||||||||||||||||||
| |||||||||||||||||||
 Tennessee results by county
Barack Obama | |||||||||||||||||||
The 2012 democratic primary in Tennessee took place on Super Tuesday, March 6, 2012, with Barack Obama receiving 80,355 (88.5%) votes. Other candidates received a combined total of 10,411 (11.5%) votes.[4] Tennessee had a total of 91 delegates to the 2012 Democratic National Convention, of which 82 were pledged to presidential contenders depending on the popular vote. The remaining 9 super-delegates were unbound.
| Tennessee Democratic primary, 2012[5] | |||||
|---|---|---|---|---|---|
| Candidate | Popular vote | Delegates | |||
| Count | Percentage | Pledged delegates | Super delegates | Total delegates | |
| 80,705 | 88.48% | 82 | 9 | 91 | |
| Uncommitted | 10,497 | 11.51% | 0 | 0 | 0 |
| John Wolfe Jr. (write-in) | 7 | 0.00% | 0 | 0 | 0 |
| Total: | 91,209 | 100% | 91 | 29 | 251 |
Republican primary
|
| |||||||||||||||||||||||||||||||||||||||||
| |||||||||||||||||||||||||||||||||||||||||
| |||||||||||||||||||||||||||||||||||||||||
 Tennessee results by county
Rick Santorum
Mitt Romney
Newt Gingrich | |||||||||||||||||||||||||||||||||||||||||

The Republican primary took place on Super Tuesday, March 6, 2012.[6][7]
Tennessee has 58 delegates to the 2012 Republican National Convention. Three super delegates are unbound. 27 delegates are awarded by congressional district, 3 delegates for each district. If a candidate wins two-third of the vote in a district, he takes all 3 delegates there; if not, delegates are split 2-to-1 between the top two candidates. Another 28 delegates are awarded to the candidate who wins two-thirds of the vote statewide, or allocated proportionately among candidates winning at least 20% of the vote if no one gets two-thirds.[8]
Results
| Tennessee Republican primary, 2012[9] | |||||||
|---|---|---|---|---|---|---|---|
| Candidate | Votes | Percentage | Projected delegate count | ||||
| NYT [10] |
CNN [11] |
FOX [12] | |||||
| 205,809 | 37.11% | 29 | 27 | 26 | |||
| Mitt Romney | 155,630 | 28.06% | 14 | 15 | 12 | ||
| Newt Gingrich | 132,889 | 23.96% | 9 | 8 | 9 | ||
| Ron Paul | 50,156 | 9.04% | 0 | 0 | 0 | ||
| Rick Perry (withdrawn) | 1,966 | 0.35% | 0 | 0 | 0 | ||
| Michele Bachmann (withdrawn) | 1,895 | 0.34% | 0 | 0 | 0 | ||
| Jon Huntsman (withdrawn) | 1,239 | 0.22% | 0 | 0 | 0 | ||
| Buddy Roemer (withdrawn) | 881 | 0.16% | 0 | 0 | 0 | ||
| Gary Johnson (withdrawn) | 572 | 0.10% | 0 | 0 | 0 | ||
| Uncommitted | 3,536 | 0.64% | 0 | 0 | 0 | ||
| Unprojected delegates: | 6 | 8 | 9 | ||||
| Total: | 554,573 | 100.00% | 58 | 58 | 58 | ||
See also
References
- ↑ "Dave Leip's Atlas of U.S. Presidential Elections - Tennessee". Retrieved 4 January 2013.
- ↑
- ↑ "Romney Poised To Prevail Over Obama". Huffington Post. November 6, 2012.
- ↑ State of Tennessee Democratic presidential primary
- ↑ "State of Tennessee March 6, 2012 Democratic Primary Presidential Preference" (PDF). http://sos.tn.gov/elections. Tennessee Secretary of State. Retrieved September 17, 2016. External link in
|website=(help) - ↑ "Primary and Caucus Printable Calendar". CNN. Retrieved January 12, 2012.
- ↑ "Presidential Primary Dates" (PDF). Federal Election Commission. Retrieved January 23, 2012.
- ↑ Nate Silver (March 4, 2012). "Romney Could Win Majority of Super Tuesday Delegates". FiveThirtyEight. Retrieved March 5, 2012.
- ↑ http://state.tn.us/sos/election/results/2012-03/RepPresStateCertCountyTotals.pdf
- ↑ Tennessee - New York Times
- ↑ Tennessee - CNN
- ↑ Tennessee - Fox News
External links
- The Green Papers for Tennessee (Republican)
- The Green Papers for Tennessee (Democratic)
- The Green Papers: Major state elections in chronological order
State results of the 2012 U.S. presidential election | ||
|---|---|---|
|  | |
| ||