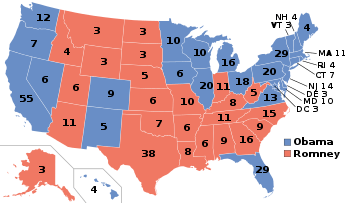
General Election
By county
| County |
Obama% |
Obama# |
Romney% |
Romney# |
Others% |
Others# |
Total |
| Aurora | 39.71% | 556 | 57.43% | 804 | 2.86% | 40 | 1,400 |
| Beadle | 39.67% | 2,881 | 58.24% | 4,230 | 2.09% | 152 | 7,263 |
| Bennett | 45.55% | 548 | 52.04% | 626 | 2.41% | 29 | 1,203 |
| Bon Homme | 37.96% | 1,167 | 59.53% | 1,830 | 2.50% | 77 | 3,074 |
| Brookings | 46.99% | 5,827 | 50.16% | 6,220 | 2.85% | 353 | 12,400 |
| Brown | 45.12% | 7,250 | 51.79% | 8,321 | 3.09% | 497 | 16,068 |
| Brule | 34.64% | 824 | 63.01% | 1,499 | 2.35% | 56 | 2,379 |
| Buffalo | 73.63% | 472 | 25.90% | 166 | 0.47% | 3 | 641 |
| Butte | 23.81% | 1,002 | 73.03% | 3,073 | 3.16% | 133 | 4,208 |
| Campbell | 19.44% | 153 | 78.27% | 616 | 2.29% | 18 | 787 |
| Charles Mix | 39.40% | 1,483 | 59.25% | 2,230 | 1.35% | 51 | 3,764 |
| Clark | 39.15% | 713 | 58.59% | 1,067 | 2.25% | 41 | 1,821 |
| Clay | 56.46% | 2,955 | 41.02% | 2,147 | 2.52% | 132 | 5,234 |
| Codington | 39.81% | 4,588 | 58.10% | 6,696 | 2.08% | 240 | 11,524 |
| Corson | 54.00% | 648 | 42.92% | 515 | 3.08% | 37 | 1,200 |
| Custer | 29.54% | 1,335 | 67.74% | 3,062 | 2.72% | 123 | 4,520 |
| Davison | 38.16% | 3,042 | 59.68% | 4,757 | 2.16% | 172 | 7,971 |
| Day | 52.11% | 1,497 | 45.95% | 1,320 | 1.95% | 56 | 2,873 |
| Deuel | 43.34% | 941 | 54.12% | 1,175 | 2.53% | 55 | 2,171 |
| Dewey | 63.69% | 1,207 | 34.99% | 663 | 1.32% | 25 | 1,895 |
| Douglas | 19.64% | 332 | 78.93% | 1,334 | 1.42% | 24 | 1,690 |
| Edmunds | 32.13% | 622 | 65.29% | 1,264 | 2.58% | 50 | 1,936 |
| Fall River | 32.42% | 1,140 | 64.22% | 2,258 | 3.36% | 118 | 3,516 |
| Faulk | 29.37% | 331 | 67.88% | 765 | 2.75% | 31 | 1,127 |
| Grant | 41.40% | 1,493 | 56.41% | 2,034 | 2.19% | 79 | 3,606 |
| Gregory | 27.85% | 599 | 70.06% | 1,507 | 2.09% | 45 | 2,151 |
| Haakon | 12.64% | 138 | 86.08% | 940 | 1.28% | 14 | 1,092 |
| Hamlin | 32.98% | 921 | 64.55% | 1,803 | 2.47% | 69 | 2,793 |
| Hand | 31.11% | 575 | 67.21% | 1,242 | 1.68% | 31 | 1,848 |
| Hanson | 31.46% | 760 | 67.34% | 1,627 | 1.20% | 29 | 2,416 |
| Harding | 11.10% | 82 | 86.33% | 638 | 2.57% | 19 | 739 |
| Hughes | 34.16% | 2,786 | 64.00% | 5,219 | 1.84% | 150 | 8,155 |
| Hutchinson | 26.95% | 923 | 71.56% | 2,451 | 1.49% | 51 | 3,425 |
| Hyde | 25.78% | 189 | 72.44% | 531 | 1.77% | 13 | 733 |
| Jackson | 38.52% | 426 | 59.76% | 661 | 1.72% | 19 | 1,106 |
| Jerauld | 44.93% | 452 | 53.48% | 538 | 1.59% | 16 | 1,006 |
| Jones | 17.73% | 108 | 80.46% | 490 | 1.81% | 11 | 609 |
| Kingsbury | 41.87% | 1,092 | 55.64% | 1,451 | 2.49% | 65 | 2,608 |
| Lake | 43.34% | 2,724 | 54.40% | 3,419 | 2.26% | 142 | 6,285 |
| Lawrence | 34.98% | 3,973 | 61.85% | 7,025 | 3.18% | 361 | 11,359 |
| Lincoln | 36.36% | 7,982 | 62.00% | 13,611 | 1.64% | 359 | 21,952 |
| Lyman | 38.56% | 605 | 59.46% | 933 | 1.98% | 31 | 1,569 |
| McCook | 53.40% | 1,061 | 44.74% | 889 | 1.86% | 37 | 1,987 |
| McPherson | 34.63% | 905 | 63.34% | 1,655 | 2.03% | 53 | 2,613 |
| Marshall | 22.39% | 272 | 75.80% | 921 | 1.81% | 22 | 1,215 |
| Meade | 27.07% | 2,928 | 69.95% | 7,566 | 2.99% | 323 | 10,817 |
| Mellette | 48.76% | 375 | 49.54% | 381 | 1.69% | 13 | 769 |
| Miner | 42.02% | 479 | 55.79% | 636 | 2.19% | 25 | 1,140 |
| Minnehaha | 45.28% | 34,674 | 52.68% | 40,342 | 2.05% | 1,567 | 76,583 |
| Moody | 47.12% | 1,429 | 50.61% | 1,535 | 2.27% | 69 | 3,033 |
| Oglala Lakota | 34.02% | 15,125 | 63.49% | 28,232 | 2.49% | 1,107 | 44,464 |
| Pennington | 20.06% | 319 | 75.79% | 1,205 | 4.15% | 66 | 1,590 |
| Perkins | 24.55% | 339 | 74.51% | 1,029 | 0.94% | 13 | 1,381 |
| Potter | 54.09% | 2,302 | 44.24% | 1,883 | 1.67% | 71 | 4,256 |
| Roberts | 34.89% | 389 | 61.70% | 688 | 3.41% | 38 | 1,115 |
| Sanborn | 93.39% | 2,937 | 05.98% | 188 | 0.64% | 20 | 3,145 |
| Spink | 42.75% | 1,300 | 54.92% | 1,670 | 2.33% | 71 | 3,041 |
| Stanley | 28.25% | 435 | 69.03% | 1,063 | 2.73% | 42 | 1,540 |
| Sully | 22.74% | 186 | 74.94% | 613 | 2.32% | 19 | 818 |
| Todd | 79.13% | 1,976 | 19.94% | 498 | 0.92% | 23 | 2,497 |
| Tripp | 27.39% | 737 | 70.79% | 1,905 | 1.82% | 49 | 2,691 |
| Turner | 33.52% | 1,411 | 64.49% | 2,715 | 2.00% | 84 | 4,210 |
| Union | 36.62% | 2,782 | 61.85% | 4,698 | 1.53% | 116 | 7,596 |
| Walworth | 27.25% | 671 | 70.31% | 1,731 | 2.44% | 60 | 2,462 |
| Yankton | 42.37% | 4,226 | 55.09% | 5,495 | 2.54% | 253 | 9,974 |
| Ziebach | 57.69% | 439 | 41.26% | 314 | 1.05% | 8 | 761 |
Republican primary
South Dakota Republican primary, 2012
|
| June 5, 2012 (2012-06-05) |
|
|
|
 South Dakota results by county
Mitt Romney
(Note: Italicization indicates a withdrawn candidacy) |
The Republican primary took place on June 5, 2012.[2] 25 delegates will be chosen, for a total of 28 delegates to go to the national convention.
| South Dakota Republican primary, 2012 |
| Candidate |
Votes |
Percentage |
Delegates |
| Mitt Romney |
34,033 |
66.1% |
25 |
| Ron Paul |
6,704 |
13.01% |
0 |
| Rick Santorum |
5,916 |
11.48% |
0 |
| Uncommitted |
2,797 |
5.43% |
0 |
| Newt Gingrich |
2,074 |
4.03% |
0 |
| Unpledged delegates: |
3 |
| Total: |
51,524 |
100.0% |
28 |
| Key: | Withdrew prior to contest |
External links
|
|---|
| Election timelines | |
|---|
| National polling | |
|---|
| State polling | |
|---|
| Fundraising | |
|---|
| Debates and forums | |
|---|
| Straw polls | |
|---|
| Major events | |
|---|
Caucuses
and primaries | |
|---|
| Results breakdown | |
|---|
National
conventions | |
|---|
| Reforms | |
|---|