Republican primary
Montana Republican caucuses, 2012
|
| June 16, 2012 (2012-06-16) |
|
|
|
 Montana results by county
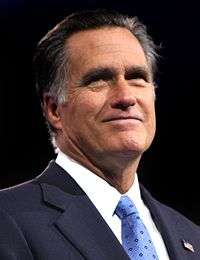
Mitt Romney
(Note: Italicization indicates a withdrawn candidacy) |
The Republican caucuses took place on June 14 to 16, 2012 as the Montana state convention. Ten days before, the state delegates were selected by the central committee in each county[1][2][3] 23 delegates were to have been chosen, for a total of 26 delegates to go to the national convention. Prior to selecting delegates, a non-binding primary election was held June 5, 2012. Results were announced before the national convention in August.
| Key: | Withdrew prior to contest |
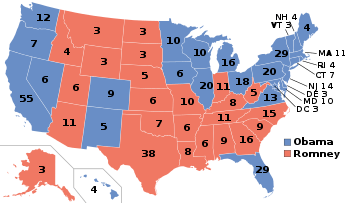
General election
The Republican ticket won by a margin of 13.65%
By county
| County |
Obama% |
Obama# |
Romney% |
Romney# |
Others% |
Others# |
Total |
| Beaverhead County | 28.49% | 1,371 | 68.35% | 3,289 | 3.16% | 152 | 4,812 |
| Big Horn County | 62.30% | 2,882 | 36.04% | 1,667 | 1.66% | 77 | 4,626 |
| Blaine County | 56.52% | 1,616 | 41.20% | 1,178 | 2.27% | 65 | 2,859 |
| Broadwater County | 25.37% | 764 | 71.47% | 2,152 | 3.16% | 95 | 3,011 |
| Carbon County | 36.71% | 2,146 | 60.43% | 3,533 | 2.86% | 167 | 5,846 |
| Carter County | 12.09% | 96 | 85.39% | 678 | 2.52% | 20 | 794 |
| Cascade County | 44.07% | 15,232 | 53.08% | 18,345 | 2.86% | 987 | 34,564 |
| Chouteau County | 34.67% | 978 | 62.32% | 1,758 | 3.01% | 85 | 2,821 |
| Custer County | 34.17% | 1,833 | 62.87% | 3,373 | 2.96% | 159 | 5,365 |
| Daniels County | 23.54% | 237 | 73.49% | 740 | 2.98% | 30 | 1,007 |
| Dawson County | 27.56% | 1,219 | 68.48% | 3,029 | 3.96% | 175 | 4,423 |
| Deer Lodge County | 64.13% | 2,860 | 32.47% | 1,448 | 3.41% | 152 | 4,460 |
| Fallon County | 16.87% | 237 | 80.28% | 1,128 | 2.85% | 40 | 1,405 |
| Fergus County | 27.01% | 1,640 | 70.12% | 4,257 | 2.87% | 174 | 6,071 |
| Flathead County | 31.95% | 13,892 | 65.11% | 28,309 | 2.93% | 1,275 | 43,476 |
| Gallatin County | 45.86% | 21,961 | 50.87% | 24,358 | 3.26% | 1,563 | 47,882 |
| Garfield County | 09.43% | 66 | 88.86% | 622 | 1.71% | 12 | 700 |
| Glacier County | 65.68% | 2,924 | 31.78% | 1,415 | 2.54% | 113 | 4,452 |
| Golden Valley County | 22.96% | 110 | 73.28% | 351 | 3.76% | 18 | 479 |
| Granite County | 31.26% | 533 | 64.93% | 1,107 | 3.81% | 65 | 1,705 |
| Hill County | 49.90% | 3,403 | 46.39% | 3,164 | 3.71% | 253 | 6,820 |
| Jefferson County | 34.85% | 2,272 | 62.19% | 4,055 | 2.96% | 193 | 6,520 |
| Judith Basin County | 27.74% | 337 | 70.29% | 854 | 1.98% | 24 | 1,215 |
| Lake County | 43.63% | 5,805 | 53.63% | 7,135 | 2.74% | 364 | 13,304 |
| Lewis and Clark County | 46.88% | 15,620 | 50.43% | 16,803 | 2.69% | 895 | 33,318 |
| Liberty County | 26.01% | 257 | 71.05% | 702 | 2.94% | 29 | 988 |
| Lincoln County | 28.71% | 2,552 | 68.14% | 6,057 | 3.15% | 280 | 8,889 |
| McCone County | 28.45% | 1,289 | 69.09% | 3,130 | 2.45% | 111 | 4,530 |
| Madison County | 22.46% | 223 | 75.03% | 745 | 2.52% | 25 | 993 |
| Meagher County | 27.67% | 269 | 68.93% | 670 | 3.4% | 33 | 972 |
| Mineral County | 34.71% | 700 | 60.29% | 1,216 | 5.01% | 101 | 2,017 |
| Missoula County | 57.39% | 32,824 | 39.61% | 22,652 | 3.% | 1,716 | 57,192 |
| Musselshell County | 20.44% | 492 | 76.15% | 1,833 | 3.41% | 82 | 2,407 |
| Park County | 43.15% | 3,783 | 53.71% | 4,709 | 3.15% | 276 | 8,768 |
| Petroleum County | 16.44% | 49 | 80.54% | 240 | 3.02% | 9 | 298 |
| Phillips County | 21.14% | 471 | 75.76% | 1,688 | 3.1% | 69 | 2,228 |
| Pondera County | 35.86% | 975 | 61.53% | 1,673 | 2.61% | 71 | 2,719 |
| Powder River County | 16.55% | 170 | 81.11% | 833 | 2.34% | 24 | 1,027 |
| Powell County | 31.99% | 888 | 65.06% | 1,806 | 2.95% | 82 | 2,776 |
| Prairie County | 23.76% | 167 | 73.97% | 520 | 2.28% | 16 | 703 |
| Ravalli County | 32.81% | 7,285 | 64.43% | 14,307 | 2.77% | 614 | 22,206 |
| Richland County | 21.57% | 1,002 | 75.57% | 3,510 | 2.86% | 133 | 4,645 |
| Roosevelt County | 56.81% | 2,086 | 41.23% | 1,514 | 1.96% | 72 | 3,672 |
| Rosebud County | 40.36% | 1,422 | 56.88% | 2,004 | 2.75% | 97 | 3,523 |
| Sanders County | 29.15% | 1,720 | 67.45% | 3,980 | 3.41% | 201 | 5,901 |
| Sheridan County | 34.49% | 665 | 62.60% | 1,207 | 2.9% | 56 | 1,928 |
| Silver Bow County | 64.79% | 10,857 | 32.41% | 5,430 | 2.8% | 469 | 16,756 |
| Stillwater County | 26.54% | 1,248 | 70.97% | 3,337 | 2.49% | 117 | 4,702 |
| Sweet Grass County | 22.44% | 475 | 75.30% | 1,594 | 2.27% | 48 | 2,117 |
| Teton County | 32.98% | 1,082 | 64.40% | 2,113 | 2.62% | 86 | 3,281 |
| Toole County | 27.69% | 582 | 68.51% | 1,440 | 3.81% | 80 | 2,102 |
| Treasure County | 25.05% | 114 | 70.11% | 319 | 4.84% | 22 | 455 |
| Valley County | 35.89% | 1,385 | 60.56% | 2,337 | 3.55% | 137 | 3,859 |
| Wheatland County | 27.42% | 272 | 69.86% | 693 | 2.72% | 27 | 992 |
| Wibaux County | 18.01% | 98 | 77.39% | 421 | 4.6% | 25 | 544 |
| Yellowstone County | 38.37% | 26,403 | 58.86% | 40,500 | 2.77% | 1,904 | 68,807 |
External links
|
|---|
| Election timelines | |
|---|
| National polling | |
|---|
| State polling | |
|---|
| Fundraising | |
|---|
| Debates and forums | |
|---|
| Straw polls | |
|---|
| Major events | |
|---|
Caucuses
and primaries | |
|---|
| Results breakdown | |
|---|
National
conventions | |
|---|
| Reforms | |
|---|


.jpg)