United States presidential election in Washington (state), 2012
|
| ||||||||||||||||||||||||||
| ||||||||||||||||||||||||||
| ||||||||||||||||||||||||||
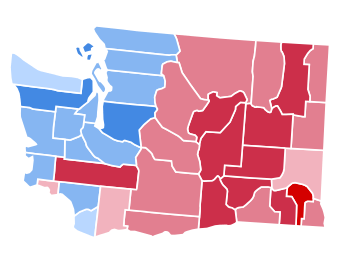 County Results
| ||||||||||||||||||||||||||
| ||||||||||||||||||||||||||
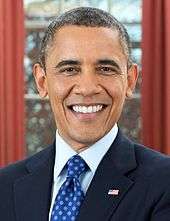
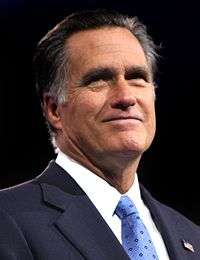
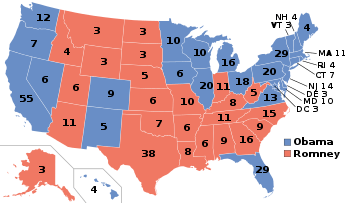
The 2012 United States presidential election in Washington took place on November 6, 2012, as part of the 2012 General Election in which all 50 states plus The District of Columbia participated. Washington voters chose 12 electors to represent them in the Electoral College via a popular vote pitting incumbent Democratic President Barack Obama and his running mate, Vice President Joe Biden, against Republican challenger and former Massachusetts Governor Mitt Romney and his running mate, Congressman Paul Ryan.
President Obama won the state of Washington comfortably, taking 56.16% to Mitt Romney's 41.29%, a 14.87% margin of victory.[1] The election continued the state's blue trend; Washington has not voted for a Republican since Ronald Reagan in 1984.
General election
Results
| United States presidential election in Washington, 2012 | ||||||
|---|---|---|---|---|---|---|
| Party | Candidate | Running mate | Votes | Percentage | Electoral votes | |
| Democratic | Barack Obama | Joe Biden | 1,755,396 | 56.16% | 12 | |
| Republican | Mitt Romney | Paul Ryan | 1,290,670 | 41.29% | 0 | |
| Libertarian | Gary Johnson | Jim Gray | 42,202 | 1.35% | 0 | |
| Green | Jill Stein | Cheri Honkala | 20,928 | 0.67% | 0 | |
| Constitution | Virgil Goode | Jim Clymer | 8,851 | 0.28% | 0 | |
| Justice | Rocky Anderson | Luis J. Rodriguez | 4,946 | 0.16% | 0 | |
| Socialism and Liberation | Peta Lindsay | Yari Osorio | 1,318 | 0.04% | 0 | |
| Socialist Workers | James Harris | Alyson Kennedy | 1,205 | 0.04% | 0 | |
| Totals | 3,125,516 | 100.00% | 12 | |||
| County | Democratic Votes (Obama) | % | Republican Votes (Romney) | % |
|---|---|---|---|---|
| Adams | 1,540 | 32.13% | 3,171 | 66.16% |
| Asotin | 4,003 | 40.43% | 5,654 | 57.11% |
| Benton | 28,145 | 35.38% | 49,461 | 62.17% |
| Chelan | 13,112 | 40.66% | 18,402 | 57.06% |
| Clallam | 18,580 | 48.81% | 18,437 | 48.43% |
| Clark | 93,382 | 48.94% | 92,951 | 48.72% |
| Columbia | 645 | 28.55% | 1,568 | 69.41% |
| Cowlitz | 22,726 | 50.93% | 20,746 | 46.49% |
| Douglas | 5,166 | 34.57% | 9,425 | 63.08% |
| Ferry | 1,294 | 37.62% | 1,995 | 57.99% |
| Franklin | 8,398 | 37.09% | 13,748 | 60.72% |
| Garfield | 336 | 26.29% | 913 | 71.44% |
| Grant | 8,950 | 32.48% | 17,852 | 64.78% |
| Grays Harbor | 15,960 | 55.64% | 11,914 | 41.54% |
| Island | 21,478 | 51.02% | 19,605 | 46.57% |
| Jefferson | 12,739 | 64.24% | 6,405 | 32.3% |
| King | 668,004 | 69.07% | 275,700 | 28.51% |
| Kitsap | 67,277 | 54.53% | 52,846 | 42.84% |
| Kittitas | 7,949 | 43.75% | 9,782 | 53.83% |
| Klickitat | 4,598 | 44.75% | 5,316 | 51.74% |
| Lewis | 12,664 | 37.2% | 20,452 | 60.08% |
| Lincoln | 1,673 | 28.49% | 4,063 | 69.19% |
| Mason | 14,764 | 52.29% | 12,761 | 45.2% |
| Okanogan | 7,108 | 42.19% | 9,221 | 54.74% |
| Pacific | 5,711 | 54.27% | 4,499 | 42.75% |
| Pend Oreille | 2,508 | 37.61% | 3,952 | 59.27% |
| Pierce | 186,430 | 54.37% | 148,467 | 43.3% |
| San Juan | 7,125 | 67.26% | 3,111 | 29.37% |
| Skagit | 26,688 | 51.91% | 25,071 | 45.36% |
| Skamania | 2,628 | 48.08% | 2,687 | 49.16% |
| Snohomish | 188,516 | 56.16% | 133,016 | 40.33% |
| Spokane | 102,295 | 45.7% | 115,285 | 51.51% |
| Stevens | 7,762 | 35.03% | 13,691 | 61.78% |
| Thurston | 74,037 | 58.27% | 49,287 | 38.79% |
| Wahkiakum | 1,094 | 47.69% | 1,119 | 48.78% |
| Walla Walla | 9,768 | 38.9% | 14,648 | 58.34% |
| Whatcom | 57,089 | 55.41% | 42,703 | 41.45% |
| Whitman | 8,037 | 46.94% | 8,507 | 49.69% |
| Yakima | 33,217 | 43.15% | 42,239 | 54.88% |
Democratic caucuses
[Data unknown/missing.]
Republican caucuses
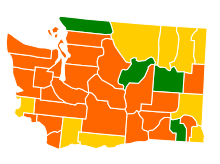
The Republican caucuses were held on March 3, 2012,[3] The additional preferential primary, as held since 1992, was canceled this year for budgetary reasons, as was the one in 2004.[4] Caucus participants however did not allocate national delegates to the candidates, they did only elected delegates to the county conventions and took part in a nonbinding strawpoll. Only the state convention on May 31 – June 2, 2012 legally pledged delegates to the national convention to specific candidates.
Caucus results
With 3,677,919 registered voters as of February 29,[5] the turnout was 1.4%.[6]
| Washington state Republican caucuses nonbinding strawpoll | |||
|---|---|---|---|
| Candidate | Votes | Percentage | |
| 19,111 | 37.65% | ||
| Ron Paul | 12,594 | 24.81% | |
| Rick Santorum | 12,089 | 23.81% | |
| Newt Gingrich | 5,221 | 10.28% | |
| Uncommitted | 1,656 | 3.26% | |
| Total Write-Ins | 93 | 0.18% | |
| Totals | 50,764 | 100.00% | |
Convention results
| Convention Results[7][8][9] | |||||||||||||
|---|---|---|---|---|---|---|---|---|---|---|---|---|---|
| Candidate | 1st | 2nd | 3rd | 4th | 5th | 6th | 7th | 8th | 9th | 10th | State | Party leaders |
Total |
| 3 | 3 | 0 | 3 | 3 | 3 | 0 | 3 | 3 | 3 | 10 | 3 | 37 | |
| Ron Paul | 0 | 0 | 2 | 0 | 0 | 0 | 3 | 0 | 0 | 0 | 0 | 0 | 5 |
| Rick Santorum | 0 | 0 | 1 | 0 | 0 | 0 | 0 | 0 | 0 | 0 | 0 | 0 | 1 |
| Total | 30 | 10 | 3 | 43 | |||||||||
See also
| Elections in Washington |
|---|
 |
|
General elections
Gubernatorial elections
Attorney General elections Secretary of State elections State Senate elections State House elections State Supreme Court elections Other judicial elections |
|
|
Part of a series on the 2012 U.S. presidential election |
|---|
| Democratic Party |
| Republican Party |
| Related races |
References
- ↑ "Washington SoS". Retrieved January 13, 2013.
- ↑ http://results.vote.wa.gov/results/20121106/President-Vice-President_ByCounty.html
- ↑ Grygiel, Chris (September 27, 2011). "Washington state GOP to hold presidential caucus March 3". Seattle Post-Intelligencer. Hearst Corporation. ISSN 0745-970X. OCLC 3734418. Retrieved January 10, 2011.
- ↑ "GOP candidates vie for delegates in Washington, feet planted in Ohio". Fox News. March 3, 2012. Retrieved March 3, 2012.
- ↑ "Elections & Voting". Washington Secretary of State - Elections Division. Retrieved March 4, 2012.
- ↑ Washington Republican - The Green Papers
- ↑ "Archived copy". Archived from the original on 2012-06-10. Retrieved 2012-07-19.
- ↑ http://www.thegreenpapers.com/P12/WA-R
- ↑ https://twitter.com/FHQ/status/209025914649067520
External links
- The Green Papers: for Washington
- The Green Papers: Major state elections in chronological order
State results of the 2012 U.S. presidential election | ||
|---|---|---|
|  | |
| ||