United States presidential election in Alabama, 2012
|
| ||||||||||||||||||||||||||
| ||||||||||||||||||||||||||
| Turnout |
73.2% | |||||||||||||||||||||||||
|---|---|---|---|---|---|---|---|---|---|---|---|---|---|---|---|---|---|---|---|---|---|---|---|---|---|---|
| ||||||||||||||||||||||||||
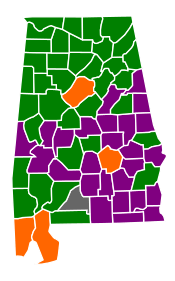
 County Results
| ||||||||||||||||||||||||||
| ||||||||||||||||||||||||||
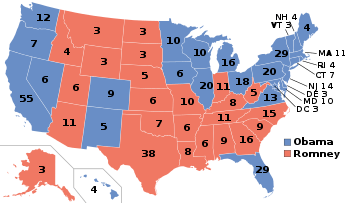
The 2012 United States presidential election in Alabama took place on November 6, 2012, as part of the 2012 General Election in which all 50 states plus The District of Columbia participated. Alabama voters chose 9 electors to represent them in the Electoral College via a popular vote pitting incumbent Democratic President Barack Obama and his running mate, Vice President Joe Biden, against Republican challenger and former Massachusetts Governor Mitt Romney and his running mate, Congressman Paul Ryan.
In 2008, Alabama was won by Republican nominee John McCain with a 21.6% margin of victory. Prior to the election, 17 news organizations considered this a state Romney would win, or otherwise considered it a safe red state. Located in the Deep South, Alabama is one of the most conservative states in the country. Alabama has not gone Democratic since it was won by Jimmy Carter in 1976.[1]
Mitt Romney won the election in Alabama with 60.55% of the vote. Barack Obama received 38.36% of the vote.[2] While the state swung slightly more Republican from 2008, Obama flipped two McCain counties, Barbour and Conecuh, into the Democratic column.
| Elections in Alabama | ||||||||
|---|---|---|---|---|---|---|---|---|
 | ||||||||
|
||||||||
|
| ||||||||
General Election
Candidate Ballot Access:
- Barack Obama/Joseph Biden, Democratic
- Mitt Romney/Paul Ryan, Republican
- Gary Johnson/James P. Gray, Libertarian
- Jill Stein/Cheri Honkala, Green
- Virgil Goode/Jim Clymer, Constitution
Write-In Candidate Access:
- Rocky Anderson/Luis J. Rodriguez, Justice
- Andre Barnett/Ken Cross, Reform
Results
| United States presidential election in Alabama, 2012 | ||||||
|---|---|---|---|---|---|---|
| Party | Candidate | Running mate | Votes | Percentage | Electoral votes | |
| Republican | Mitt Romney | Paul Ryan | 1,255,925 | 60.55% | 9 | |
| Democratic | Barack Obama | Joe Biden | 797,696 | 38.36% | 0 | |
| Libertarian | Gary Johnson | Jim Gray | 12,328 | 0.59% | 0 | |
| Write-Ins | Write-Ins | 4,011 | 0.19% | 0 | ||
| Green | Jill Stein | Cheri Honkala | 3,397 | 0.16% | 0 | |
| Constitution | Virgil Goode | Jim Clymer | 2,981 | 0.14% | 0 | |
| Totals | 2,074,338 | 100.00% | 9 | |||
Results by county
| County | Romney# | Romney% | Obama# | Obama% | Other# | Other% | Total Votes |
|---|---|---|---|---|---|---|---|
| Autauga | 17,379 | 72.49% | 6,363 | 26.54% | 231 | 0.96% | 23,973 |
| Baldwin | 66,016 | 77.22% | 18,424 | 21.55% | 1,051 | 1.23% | 85,491 |
| Barbour | 5,550 | 48.19% | 5,912 | 51.33% | 55 | 0.48% | 11,517 |
| Bibb | 6,132 | 72.83% | 2,202 | 26.15% | 86 | 1.02% | 8,420 |
| Blount | 20,757 | 86.27% | 2,970 | 12.34% | 333 | 1.38% | 24,060 |
| Bullock | 1,251 | 23.51% | 4,061 | 76.31% | 10 | 0.19% | 5,322 |
| Butler | 5,087 | 53.54% | 4,374 | 46.03% | 41 | 0.43% | 9,502 |
| Calhoun | 30,278 | 65.30% | 15,511 | 33.45% | 575 | 1.24% | 46,364 |
| Chambers | 7,626 | 52.13% | 6,871 | 46.97% | 132 | 0.90% | 14,629 |
| Cherokee | 7,506 | 76.65% | 2,132 | 21.77% | 154 | 1.57% | 9,792 |
| Chilton | 13,932 | 79.68% | 3,397 | 19.43% | 156 | 0.89% | 17,485 |
| Choctaw | 4,152 | 52.06% | 3,786 | 47.47% | 38 | 0.48% | 7,976 |
| Clarke | 7,470 | 53.90% | 6,334 | 45.70% | 56 | 0.40% | 13,860 |
| Clay | 4,817 | 72.12% | 1,777 | 26.61% | 85 | 1.27% | 6,679 |
| Cleburne | 5,272 | 83.43% | 971 | 15.37% | 76 | 1.20% | 6,319 |
| Coffee | 14,666 | 73.99% | 4,925 | 24.85% | 230 | 1.16% | 19,821 |
| Colbert | 13,936 | 59.44% | 9,166 | 39.10% | 342 | 1.46% | 23,444 |
| Conecuh | 3,439 | 48.95% | 3,555 | 50.60% | 31 | 0.44% | 7,025 |
| Coosa | 3,049 | 57.72% | 2,191 | 41.48% | 42 | 0.80% | 5,282 |
| Covington | 12,153 | 78.72% | 3,158 | 20.45% | 128 | 0.83% | 15,439 |
| Crenshaw | 4,331 | 67.42% | 2,050 | 31.91% | 43 | 0.67% | 6,424 |
| Cullman | 28,999 | 83.92% | 5,052 | 14.62% | 504 | 1.46% | 34,555 |
| Dale | 13,108 | 70.47% | 5,286 | 28.42% | 207 | 1.11% | 18,601 |
| Dallas | 6,288 | 29.99% | 14,612 | 69.70% | 64 | 0.31% | 20,964 |
| DeKalb | 18,331 | 76.54% | 5,239 | 21.87% | 380 | 1.59% | 23,950 |
| Elmore | 26,253 | 73.86% | 8,954 | 25.19% | 339 | 0.95% | 35,546 |
| Escambia | 9,287 | 62.35% | 5,489 | 36.85% | 118 | 0.79% | 14,894 |
| Etowah | 29,130 | 68.34% | 12,803 | 30.04% | 691 | 1.62% | 42,624 |
| Fayette | 6,054 | 76.07% | 1,817 | 22.83% | 87 | 1.09% | 7,958 |
| Franklin | 7,567 | 69.54% | 3,171 | 29.14% | 143 | 1.31% | 10,881 |
| Geneva | 9,175 | 80.97% | 2,039 | 17.99% | 117 | 1.03% | 11,331 |
| Greene | 804 | 15.05% | 4,521 | 84.62% | 18 | 0.34% | 5,343 |
| Hale | 3,210 | 37.12% | 5,411 | 62.58% | 26 | 0.30% | 8,647 |
| Henry | 5,628 | 64.20% | 3,083 | 35.17% | 55 | 0.63% | 8,766 |
| Houston | 29,270 | 69.72% | 12,367 | 29.46% | 347 | 0.83% | 41,984 |
| Jackson | 14,439 | 69.98% | 5,822 | 28.22% | 371 | 1.80% | 20,632 |
| Jefferson | 141,683 | 46.53% | 159,876 | 52.50% | 2,964 | 0.97% | 304,523 |
| Lamar | 5,457 | 76.05% | 1,646 | 22.94% | 73 | 1.02% | 7,176 |
| Lauderdale | 23,911 | 64.57% | 12,511 | 33.78% | 610 | 1.65% | 37,032 |
| Lawrence | 8,874 | 62.72% | 5,069 | 35.83% | 205 | 1.45% | 14,148 |
| Lee | 32,194 | 59.08% | 21,381 | 39.23% | 921 | 1.69% | 54,496 |
| Limestone | 25,295 | 71.17% | 9,829 | 27.66% | 416 | 1.17% | 35,540 |
| Lowndes | 1,756 | 23.34% | 5,747 | 76.39% | 20 | 0.27% | 7,523 |
| Macon | 1,331 | 12.80% | 9,045 | 87.00% | 20 | 0.19% | 10,396 |
| Madison | 90,884 | 58.47% | 62,015 | 39.90% | 2,529 | 1.63% | 155,428 |
| Marengo | 5,336 | 46.23% | 6,167 | 53.43% | 40 | 0.35% | 11,543 |
| Marion | 9,697 | 79.95% | 2,249 | 18.54% | 183 | 1.51% | 12,129 |
| Marshall | 25,867 | 79.24% | 6,299 | 19.30% | 478 | 1.46% | 32,644 |
| Mobile | 94,893 | 54.18% | 78,760 | 44.97% | 1,487 | 0.85% | 175,140 |
| Monroe | 5,741 | 53.57% | 4,914 | 45.85% | 62 | 0.58% | 10,717 |
| Montgomery | 38,332 | 37.56% | 63,085 | 61.81% | 650 | 0.64% | 102,067 |
| Morgan | 35,391 | 71.56% | 13,439 | 27.17% | 629 | 1.27% | 49,459 |
| Perry | 1,506 | 24.68% | 4,568 | 74.87% | 27 | 0.44% | 6,101 |
| Pickens | 5,124 | 53.26% | 4,455 | 46.30% | 42 | 0.44% | 9,621 |
| Pike | 7,963 | 56.38% | 6,035 | 42.73% | 125 | 0.89% | 14,123 |
| Randolph | 7,224 | 69.32% | 3,078 | 29.54% | 119 | 1.14% | 10,421 |
| Russell | 8,278 | 43.78% | 10,500 | 55.53% | 132 | 0.70% | 18,910 |
| Shelby | 71,436 | 77.03% | 20,051 | 21.62% | 1,255 | 1.35% | 92,742 |
| St. Clair | 29,031 | 82.39% | 5,801 | 16.46% | 403 | 1.14% | 35,235 |
| Sumter | 1,586 | 22.56% | 5,421 | 77.11% | 23 | 0.33% | 7,030 |
| Talladega | 19,246 | 57.60% | 13,905 | 41.61% | 265 | 0.79% | 33,416 |
| Tallapoosa | 12,396 | 65.76% | 6,319 | 33.52% | 136 | 0.72% | 18,851 |
| Tuscaloosa | 45,748 | 58.08% | 32,048 | 40.68% | 976 | 1.24% | 78,772 |
| Walker | 21,651 | 75.74% | 6,557 | 22.94% | 377 | 1.32% | 28,585 |
| Washington | 5,761 | 65.56% | 2,976 | 33.87% | 50 | 0.57% | 8,787 |
| Wilcox | 1,679 | 25.61% | 4,868 | 74.26% | 8 | 0.12% | 6,555 |
| Winston | 8,312 | 85.44% | 1286 | 13.22% | 130 | 1.34% | 9,728 |
Polling
Opinion polls that have been taken in Alabama have consistently showed Mitt Romney to be leading Barack Obama.
Predictions
The latest predictions:
- Cook Political Report: Solid Republican[3]
- Election Projection: Solid Romney[4]
- Electoral-vote.com: Strongly Republican[5]
- Real Clear Politics: Safe Romney[6]
- CNN: Safe Romney[7]
- MSNBC: Republican[8]
- The Washington Post: Solid Republican[9]
- 270 to win: Safe Romney[10]
- Belanger Report: Safe Romney
- FiveThirtyEight: Solid Romney[11]
Democratic primary

Republican primary
|
| |||||||||||||||||||||||||
| |||||||||||||||||||||||||
| |||||||||||||||||||||||||
 Alabama results by county
Rick Santorum
Newt Gingrich
Mitt Romney
Tie | |||||||||||||||||||||||||
The 2012 Alabama Republican primary took place on March 13, 2012, on the same day as the Mississippi Republican primary and the Hawaii Republican caucuses.[12][13] Rick Santorum was declared the winner.[14]
| Alabama Republican primary, 2012[15] | |||||||
|---|---|---|---|---|---|---|---|
| Candidate | Votes | Percentage | Projected delegate count | ||||
| AP [16] |
CNN [17] |
FOX | |||||
| Rick Santorum | 215,105 | 34.55% | 22 | 18 | – | ||
| Newt Gingrich | 182,276 | 29.28% | 14 | 9 | – | ||
| Mitt Romney | 180,321 | 28.97% | 11 | 9 | – | ||
| Ron Paul | 30,937 | 4.97% | 0 | 0 | – | ||
| Rick Perry (withdrawn) | 1,867 | 0.30% | 0 | 0 | – | ||
| Michele Bachmann (withdrawn) | 1,700 | 0.27% | 0 | 0 | – | ||
| Jon Huntsman (withdrawn) | 1,049 | 0.17% | 0 | 0 | – | ||
| Uncommitted | 9,259 | 1.49% | 0 | 0 | – | ||
| Unprojected delegates | 3 | 14 | 50 | ||||
| Total: | 622,514 | 100.00% | 50 | 50 | 50 | ||
See also
- List of United States presidential electors, 2012
- United States presidential election, 2012
- United States presidential election in Alabama, 2008
- Republican Party presidential debates, 2012
- Republican Party presidential primaries, 2012
- Results of the 2012 Republican Party presidential primaries
- Alabama Republican Party
References
- ↑ "Certified General Election Results without write-in appendix" (PDF). Secretary of State of Alabama. 2008-11-25. Retrieved 2012-06-07.
- ↑ "Dave Leip's Atlas of U.S. Presidential Elections – Idaho". Retrieved 4 January 2013.
- ↑ Presidential | The Cook Political Report
- ↑ Election Projection: 2012 Elections – Polls, Projections, Results
- ↑ Electoral-vote.com: President, Senate, House Updated Daily
- ↑ RealClearPolitics – Electoral Map
- ↑ "CNN Political Ticker – CNN.com Blogs". CNN. Retrieved June 7, 2012.
- ↑ http://www.msnbc.msn.com/id/3032553/#.T9BgKrXCS04
- ↑ "2012 Presidential Election Results". The Washington Post.
- ↑ http://www.270towin.com/states/Alabama/
- ↑ "New Home for FiveThirtyEight". The New York Times.
- ↑ Alabama Republican – The Green Papers
- ↑ Beyerle, Dana (November 14, 2011). "Republican primary qualifying opens today". The Tuscaloosa News. Halifax Media Group. Retrieved January 11, 2011.
- ↑ "Alabama Election Result 2015 live". infoelections.
- ↑ "Archived copy" (PDF). Archived from the original (PDF) on 2012-09-11. Retrieved 2012-04-11.
- ↑ Alabama – AP/Google
- ↑ Alabama CNN
External links
- Official website of the Alabama Republican Party
- Official website of the Alabama Democratic Party
- Official website of the Alabama Green Party
- The Green Papers: for Alabama
- The Green Papers: Major state elections in chronological order
State results of the 2012 U.S. presidential election | ||
|---|---|---|
|  | |
| ||