United States presidential election in Minnesota, 2012
|
|
|
| Turnout |
76.42%[1]  |
|---|
|
|
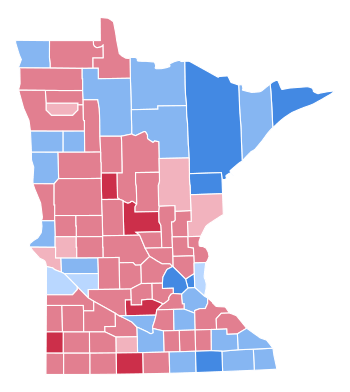 County Results
|
Obama
40-50%
50-60%
60-70%
|
Romney
40-50%
50-60%
60-70%
|
|
|
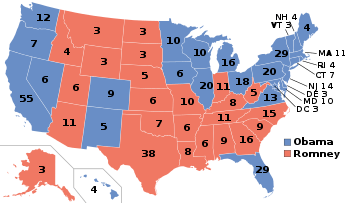
The 2012 United States presidential election in Minnesota took place on November 6, 2012, as part of the 2012 General Election in which all 50 states plus The District of Columbia participated. Minnesota voters chose 10 electors to represent them in the Electoral College via a popular vote pitting incumbent Democratic President Barack Obama and his running mate, Vice President Joe Biden, against Republican challenger and former Massachusetts Governor Mitt Romney and his running mate, Congressman Paul Ryan.
Minnesota backed incumbent Democratic President Barack Obama for re-election, giving him 52.65% of the vote, while Republican challenger Mitt Romney took 44.96%, a victory margin of 7.69%. With ten Democratic wins in a row, Minnesota has the longest current streak of voting for the Democratic candidate in presidential elections of any state, having not voted Republican since Richard Nixon in 1972. This is also the longest streak for the Democrats in history amongst non-Southern States.
General Election
Results
| United States presidential election in Minnesota, 2012[2] |
| Party |
Candidate |
Running mate |
Votes |
Percentage |
Electoral votes |
|
Democratic |
Barack Obama |
Joe Biden |
1,546,167 |
52.65% |
10 |
|
Republican |
Mitt Romney |
Paul Ryan |
1,320,225 |
44.96% |
0 |
|
Libertarian |
Gary Johnson |
Jim Gray |
35,098 |
1.20% |
0 |
|
Green |
Jill Stein |
Cheri Honkala |
13,023 |
0.44% |
0 |
|
Constitution |
Virgil Goode |
Jim Clymer |
3,722 |
0.13% |
0 |
|
Grassroots |
Jim Carlson |
George McMahon |
3,149 |
0.11% |
0 |
|
Justice |
Rocky Anderson |
Luis J. Rodriguez |
1,996 |
0.07% |
0 |
|
Constitutional Government |
Dean Morstad |
Josh Franke-Hyland |
1,092 |
0.04% |
0 |
|
Socialist Workers |
James Harris |
Maura DeLuca |
1,051 |
0.04% |
0 |
|
Socialism and Liberation |
Peta Lindsay |
Yari Osorio |
397 |
0.01% |
0 |
|
Write-Ins |
|
|
10,641 |
0.36% |
0 |
|
| Totals |
2,936,561 |
100.00% |
10 |
| Voter turnout (eligible voters) |
75.74% |
By county
| County |
Obama % |
Obama Votes |
Romney % |
Romney Votes |
Others % |
Others Votes |
Total Votes |
| Aitkin | 48.26% | 4,412 | 49.58% | 4,533 | 2.15% | 197 | 9,142 |
| Anoka | 47.52% | 88,611 | 50.11% | 93,430 | 2.37% | 4,420 | 186,461 |
| Becker | 41.69% | 6,829 | 56.18% | 9,204 | 2.13% | 349 | 16,382 |
| Beltrami | 53.59% | 11,818 | 43.70% | 9,637 | 2.70% | 596 | 22,051 |
| Benton | 41.66% | 8,173 | 55.30% | 10,849 | 3.04% | 597 | 19,619 |
| Big Stone | 48.23% | 1,345 | 49.66% | 1,385 | 2.12% | 59 | 2,789 |
| Blue Earth | 53.00% | 18,164 | 43.52% | 14,916 | 3.48% | 1,194 | 34,274 |
| Brown | 40.42% | 5,630 | 56.99% | 7,938 | 2.59% | 361 | 13,929 |
| Carlton | 61.78% | 11,389 | 35.72% | 6,586 | 2.50% | 461 | 18,436 |
| Carver | 39.22% | 20,745 | 58.90% | 31,155 | 1.89% | 999 | 52,899 |
| Cass | 42.49% | 6,858 | 55.49% | 8,957 | 2.02% | 326 | 16,141 |
| Chippewa | 49.72% | 3,083 | 47.85% | 2,967 | 2.44% | 151 | 6,201 |
| Chisago | 42.54% | 12,524 | 55.12% | 16,227 | 2.34% | 690 | 29,441 |
| Clay | 52.65% | 15,208 | 44.73% | 12,920 | 2.62% | 758 | 28,886 |
| Clearwater | 41.77% | 1,753 | 56.21% | 2,359 | 2.03% | 85 | 4,197 |
| Cook | 59.99% | 1,993 | 36.75% | 1,221 | 3.25% | 108 | 3,322 |
| Cottonwood | 41.50% | 2,433 | 56.57% | 3,316 | 1.93% | 113 | 5,862 |
| Crow Wing | 42.27% | 14,760 | 55.60% | 19,415 | 2.13% | 745 | 34,920 |
| Dakota | 50.37% | 116,252 | 47.45% | 109,514 | 2.19% | 5,049 | 230,815 |
| Dodge | 43.46% | 4,487 | 53.48% | 5,522 | 3.06% | 316 | 10,325 |
| Douglas | 41.29% | 8,665 | 56.73% | 11,905 | 1.98% | 416 | 20,986 |
| Faribault | 44.17% | 3,407 | 53.21% | 4,104 | 2.62% | 202 | 7,713 |
| Fillmore | 52.45% | 5,713 | 45.11% | 4,913 | 2.44% | 266 | 10,892 |
| Freeborn | 55.82% | 9,326 | 41.72% | 6,969 | 2.46% | 411 | 16,706 |
| Goodhue | 47.33% | 12,212 | 50.33% | 12,986 | 2.34% | 603 | 25,801 |
| Grant | 47.23% | 1,647 | 50.13% | 1,748 | 2.64% | 92 | 3,487 |
| Hennepin | 62.34% | 423,979 | 35.30% | 240,073 | 2.35% | 16,007 | 680,059 |
| Houston | 50.56% | 5,281 | 47.40% | 4,951 | 2.05% | 214 | 10,446 |
| Hubbard | 40.59% | 4,676 | 57.48% | 6,622 | 1.93% | 222 | 11,520 |
| Isanti | 39.69% | 8,024 | 57.75% | 11,675 | 2.56% | 518 | 20,217 |
| Itasca | 53.73% | 12,852 | 43.90% | 10,500 | 2.37% | 566 | 23,918 |
| Jackson | 41.77% | 2,268 | 56.06% | 3,044 | 2.17% | 118 | 5,430 |
| Kanabec | 44.09% | 3,593 | 53.10% | 4,328 | 2.81% | 229 | 8,150 |
| Kandiyohi | 45.68% | 9,806 | 52.36% | 11,239 | 1.96% | 420 | 21,465 |
| Kittson | 51.32% | 1,241 | 45.29% | 1,095 | 3.39% | 82 | 2,418 |
| Koochiching | 53.44% | 3,451 | 43.99% | 2,841 | 2.57% | 166 | 6,458 |
| Lac Qui Parle | 49.55% | 1,974 | 48.64% | 1,938 | 1.81% | 72 | 3,984 |
| Lake | 59.31% | 4,043 | 38.29% | 2,610 | 2.41% | 164 | 6,817 |
| Lake of the Woods | 38.45% | 859 | 58.46% | 1,306 | 3.09% | 69 | 2,234 |
| Le Sueur | 45.65% | 6,753 | 52.14% | 7,714 | 2.21% | 327 | 14,794 |
| Lincoln | 45.80% | 1,428 | 51.12% | 1,594 | 3.08% | 96 | 3,118 |
| Lyon | 44.11% | 5,465 | 53.23% | 6,595 | 2.66% | 329 | 12,389 |
| Mahnomen | 58.48% | 1,276 | 39.92% | 871 | 1.60% | 35 | 2,182 |
| McLeod | 37.56% | 6,968 | 59.66% | 11,069 | 2.78% | 516 | 18,553 |
| Marshall | 42.53% | 1,998 | 54.68% | 2,569 | 2.79% | 131 | 4,698 |
| Martin | 36.96% | 4,054 | 60.69% | 6,657 | 2.34% | 257 | 10,968 |
| Meeker | 40.68% | 4,969 | 56.60% | 6,913 | 2.72% | 332 | 12,214 |
| Mille Lacs | 44.53% | 5,829 | 53.10% | 6,951 | 2.38% | 311 | 13,091 |
| Morrison | 36.81% | 6,153 | 60.78% | 10,159 | 2.41% | 402 | 16,714 |
| Mower | 60.03% | 11,129 | 37.42% | 6,938 | 2.55% | 472 | 18,539 |
| Murray | 45.31% | 2,160 | 52.53% | 2,504 | 2.16% | 103 | 4,767 |
| Nicollet | 52.58% | 9,652 | 44.75% | 8,214 | 2.67% | 491 | 18,357 |
| Nobles | 44.52% | 3,793 | 53.77% | 4,581 | 1.71% | 146 | 8,520 |
| Norman | 53.94% | 1,730 | 43.16% | 1,384 | 2.90% | 93 | 3,207 |
| Olmsted | 50.23% | 39,338 | 47.03% | 36,832 | 2.74% | 2,146 | 78,316 |
| Otter Tail | 38.41% | 12,165 | 59.55% | 18,860 | 2.04% | 645 | 31,670 |
| Pennington | 46.41% | 3,024 | 50.71% | 3,304 | 2.89% | 188 | 6,516 |
| Pine | 48.34% | 6,750 | 49.02% | 6,845 | 2.65% | 370 | 13,965 |
| Pipestone | 37.13% | 1,725 | 60.83% | 2,826 | 2.04% | 95 | 4,646 |
| Polk | 46.10% | 6,773 | 51.83% | 7,615 | 2.08% | 305 | 14,693 |
| Pope | 47.73% | 2,981 | 50.30% | 3,142 | 1.97% | 123 | 6,246 |
| Ramsey | 66.33% | 184,936 | 31.13% | 86,799 | 2.54% | 7,086 | 278,821 |
| Red Lake | 46.99% | 928 | 49.52% | 978 | 3.49% | 69 | 1,975 |
| Redwood | 38.61% | 3,008 | 58.66% | 4,570 | 2.72% | 212 | 7,790 |
| Renville | 44.02% | 3,394 | 53.81% | 4,149 | 2.17% | 167 | 7,710 |
| Rice | 52.85% | 17,054 | 44.58% | 14,384 | 2.57% | 829 | 32,267 |
| Rock | 40.16% | 1,946 | 57.99% | 2,810 | 1.86% | 90 | 4,846 |
| Roseau | 37.70% | 2,772 | 59.97% | 4,409 | 2.33% | 171 | 7,352 |
| Scott | 41.47% | 29,714 | 56.28% | 40,321 | 2.25% | 1,612 | 71,647 |
| Sherburne | 37.84% | 17,597 | 59.88% | 27,847 | 2.29% | 1,064 | 46,508 |
| Sibley | 37.31% | 2,916 | 60.05% | 4,693 | 2.64% | 206 | 7,815 |
| St. Louis | 63.48% | 73,376 | 33.85% | 39,131 | 2.67% | 3,085 | 115,592 |
| Stearns | 42.75% | 33,551 | 54.81% | 43,015 | 2.44% | 1,911 | 78,477 |
| Steele | 45.52% | 8,706 | 51.78% | 9,903 | 2.69% | 515 | 19,124 |
| Stevens | 48.51% | 2,742 | 48.94% | 2,766 | 2.55% | 144 | 5,652 |
| Swift | 53.74% | 2,751 | 43.91% | 2,248 | 2.34% | 120 | 5,119 |
| Todd | 40.83% | 4,819 | 56.93% | 6,719 | 2.25% | 265 | 11,803 |
| Traverse | 51.06% | 942 | 46.61% | 860 | 2.33% | 43 | 1,845 |
| Wabasha | 46.03% | 5,415 | 51.42% | 6,049 | 2.54% | 299 | 11,763 |
| Wadena | 36.70% | 2,492 | 61.02% | 4,143 | 2.28% | 155 | 6,790 |
| Waseca | 44.83% | 4,370 | 52.49% | 5,116 | 2.68% | 261 | 9,747 |
| Washington | 49.39% | 70,203 | 48.64% | 69,137 | 1.97% | 2,793 | 142,133 |
| Watonwan | 48.48% | 2,494 | 48.93% | 2,517 | 2.59% | 133 | 5,144 |
| Wilkin | 39.04% | 1,258 | 58.47% | 1,884 | 2.48% | 80 | 3,222 |
| Winona | 55.01% | 14,980 | 42.16% | 11,480 | 2.83% | 772 | 27,232 |
| Wright | 37.95% | 25,739 | 59.67% | 40,468 | 2.37% | 1,609 | 67,816 |
| Yellow Medicine | 45.53% | 2,465 | 51.83% | 2,806 | 2.64% | 143 | 5,414 |
| Minnesota Total | 52.65% | 1,546,021 | 44.95% | 1,320,048 | 2.38% | 70,139 | 2,936,208 |
Democratic caucuses
Minnesota Democratic caucus, 2012
|
| February 7, 2012 (2012-02-07) |
|
|
|
 Minnesota results by county
Barack Obama
No votes |
| Minnesota Democratic caucus, 2012[3] |
|---|
| Candidate |
Votes |
Percentage |
Delegates |
 Barack Obama Barack Obama |
16,733 |
96.30% |
91 |
| Uncommited |
643 |
3.70% |
0 |
Republican caucuses
Minnesota Republican caucus, 2012
|
| February 7, 2012 (2012-02-07) |
|
|
|
 Minnesota results by county
Rick Santorum
Ron Paul
Tie |
The Republican caucuses were held on February 7, 2012.[4] The events coincided with the Colorado Republican caucuses as well as the Missouri Republican primary. Minnesota has a total of 40 delegates, 37 of which are tied to the caucuses while 3 are unpledged RNC delegates. The non-binding straw poll was won by Rick Santorum, but Ron Paul won 32 of the 40 delegates to the Republican National Convention.
Results with 100.0% (4,137 of 4,137 precincts) reporting:
| Election Reporting[5][6][7][8][9] |
| Candidate |
Votes |
Delegates |
| Total |
Percentage |
Total |
Percentage |
|
| Rick Santorum |
21,988 |
44.95% |
2 |
5% |
| Ron Paul |
13,282 |
27.15% |
32 |
80% |
| Mitt Romney |
8,240 |
16.85% |
1 |
2.5% |
| Newt Gingrich |
5,263 |
10.76% |
0 |
0% |
| Write-in |
143 |
0.29% |
0 |
0% |
| Unpledged delegates: |
5 |
12.5% |
| Total: |
48,916 |
100.0% |
40 |
100.0% |
Conventions
There is no formal system of allocating delegates to candidates in any step of the election process. At each meeting the participants decides what the best course of action is. The state convention can vote to bind the 13 at-large delegates to a candidate. The 24 delegates elected at the CD conventions and the 3 automatic (RNC) delegates are not legally bound to vote for a candidate.
- 17 February - 31 March: BPOU conventions elect delegates to the state convention and the congressional district conventions.
- 14–21 April: Eight congressional conventions elect 3 National Convention delegates each.
- 18–19 May: State convention elect 13 National Convention delegates.[10]
| Convention Results[6][8][9] |
|---|
| Candidate |
1st |
2nd |
3rd |
4th |
5th |
6th |
7th |
8th |
State |
Party
leaders |
Total |
| Ron Paul |
2 |
3 |
3 |
3 |
3 |
3 |
1 |
2 |
12 |
0 |
32 |
| Rick Santorum |
0 |
0 |
0 |
0 |
0 |
0 |
2 |
0 |
0 |
0 |
2 |
| Mitt Romney |
0 |
0 |
0 |
0 |
0 |
0 |
0 |
0 |
1 |
0 |
1 |
| Unknown |
1 |
|
|
|
|
|
|
1 |
|
3 |
5 |
| Total |
24 |
13 |
3 |
40 |
References
- ↑ "Office of the State Of Minnesota Secretary of State". www.sos.state.mn.us. Retrieved 2017-07-22.
- ↑ "Minnesota Secretary of State". Retrieved 2012-11-10.
- ↑ "Presidential Preference by County". Minnesota Secretary of State. Archived from the original on 2016-10-09. Retrieved 2016-10-07.
- ↑ Scheck, Tom (September 30, 2011). "MNGOP keeping Feb. 7 Caucus date". Capitol View. Minnesota Public Radio.
- ↑ "Election Reporting System: Statewide Results for Republican Party". Minnesota Secretary of State. Retrieved March 1, 2012.
- 1 2 "Paul supporters chosen as delegates in three congressional districts". Pierce County Herald. April 15, 2012. Archived from the original on April 19, 2012. Retrieved April 17, 2012.
- ↑ Anderson, Pat (21 April 2012). "Ron Paul gets 20/24 Congressional District delegates. CD4 3, CD2 3, CD8 2, CD1 2 #mngop #mnleg". twitter.com. Twitter. Retrieved 22 April 2012.
- 1 2 "Rep. Paul supporters elected to half of Minnesota GOP convention delegation". Pierce County Herald. April 22, 2012. Archived from the original on April 25, 2012. Retrieved April 22, 2012.
- 1 2 "Ron Paul Wins Minnesota State Convention". Retrieved 20 May 2012.
- ↑ "Republican Party of Minnesota Events". Retrieved 4 May 2012.
External links
|
|---|
| Election timelines | |
|---|
| National polling | |
|---|
| State polling | |
|---|
| Fundraising | |
|---|
| Debates and forums | |
|---|
| Straw polls | |
|---|
| Major events | |
|---|
Caucuses
and primaries | |
|---|
| Results breakdown | |
|---|
National
conventions | |
|---|
| Reforms | |
|---|