United States presidential election in Mississippi, 2012
|
|
|
|
|
 County Results
|
Romney
40-50%
50-60%
60-70%
70-80%
80-90%
|
Obama
40-50%
50-60%
60-70%
70-80%
80-90%
|
|
|
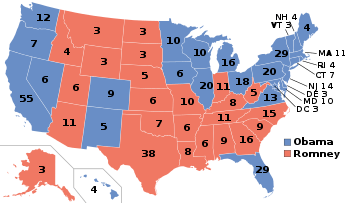
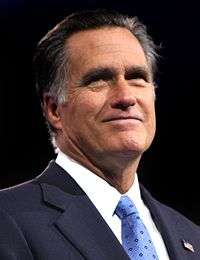
The 2012 United States presidential election in Mississippi took place on November 6, 2012, as part of the 2012 General Election in which all 50 states plus The District of Columbia participated. Mississippi voters chose six electors to represent them in the Electoral College via a popular vote pitting incumbent Democratic President Barack Obama and his running mate, Vice President Joe Biden, against Republican challenger and former Massachusetts Governor Mitt Romney and his running mate, Congressman Paul Ryan.
Romney and Ryan won Mississippi with 55.3% of the popular vote to Obama's and Biden's 43.8%, thus winning the state's six electoral votes.[1] Mississippi was one of just six states where Obama improved on his 2008 performance. According to exit polls, the black vote share in Mississippi increased from 33% in 2008 to 36% in 2012, likely explaining Obama's gains.[2] This was the strongest showing for a Democratic presidential candidate in Mississippi since native Southerner Bill Clinton's 44.08% in 1996. Obama carried Warren County, becoming the first Democrat to do so since John F. Kennedy in 1960.[3]
General Election
By county
| County |
Obama% |
Obama# |
Romney% |
Romney# |
Others% |
Others# |
Total |
| Adams County | 58.66% | 9,061 | 40.74% | 6,293 | 0.60% | 93 | 15,447 |
| Alcorn County | 23.67% | 3,511 | 74.92% | 11,111 | 1.40% | 208 | 14,830 |
| Amite County | 42.07% | 3,242 | 57.28% | 4,414 | 0.65% | 50 | 7,706 |
| Attala County | 43.19% | 3,927 | 56.38% | 5,126 | 0.43% | 39 | 9,092 |
| Benton County | 49.83% | 2,051 | 49.59% | 2,041 | 0.58% | 24 | 4,116 |
| Bolivar County | 68.59% | 10,582 | 30.47% | 4,701 | 0.94% | 145 | 15,428 |
| Calhoun County | 36.59% | 2,586 | 62.42% | 4,412 | 0.99% | 70 | 7,068 |
| Carroll County | 33.49% | 2,007 | 66.09% | 3,960 | 0.42% | 25 | 5,992 |
| Chickasaw County | 51.49% | 4,378 | 46.97% | 3,994 | 1.54% | 131 | 8,503 |
| Choctaw County | 33.42% | 1,428 | 65.81% | 2,812 | 0.77% | 33 | 4,273 |
| Claiborne County | 88.22% | 4,838 | 11.40% | 625 | 0.38% | 21 | 5,484 |
| Clarke County | 37.70% | 3,111 | 61.18% | 5,049 | 1.13% | 93 | 8,253 |
| Clay County | 60.62% | 6,712 | 38.76% | 4,291 | 0.62% | 69 | 11,072 |
| Coahoma County | 73.86% | 7,792 | 25.71% | 2,712 | 0.43% | 45 | 10,549 |
| Copiah County | 54.87% | 7,749 | 44.48% | 6,282 | 0.65% | 92 | 14,123 |
| Covington County | 41.48% | 3,878 | 57.82% | 5,405 | 0.70% | 65 | 9,348 |
| DeSoto County | 32.79% | 21,575 | 66.21% | 43,559 | 1.00% | 660 | 65,794 |
| Forrest County | 43.89% | 13,272 | 54.82% | 16,574 | 1.29% | 390 | 30,236 |
| Franklin County | 38.42% | 1,726 | 60.87% | 2,735 | 0.71% | 32 | 4,493 |
| George County | 13.79% | 1,359 | 84.98% | 8,376 | 1.23% | 121 | 9,856 |
| Greene County | 22.37% | 1,325 | 76.51% | 4,531 | 1.11% | 66 | 5,922 |
| Grenada County | 46.65% | 5,288 | 52.81% | 5,986 | 0.54% | 61 | 11,335 |
| Hancock County | 22.82% | 3,917 | 75.52% | 12,964 | 1.67% | 286 | 17,167 |
| Harrison County | 36.51% | 23,119 | 62.33% | 39,470 | 1.17% | 739 | 63,328 |
| Hinds County | 71.47% | 76,112 | 27.86% | 29,664 | 0.67% | 715 | 106,491 |
| Holmes County | 84.11% | 7,812 | 15.45% | 1,435 | 0.44% | 41 | 9,288 |
| Humphreys County | 74.88% | 3,903 | 24.81% | 1,293 | 0.31% | 16 | 5,212 |
| Issaquena County | 60.86% | 479 | 38.37% | 302 | 0.76% | 6 | 787 |
| Itawamba County | 18.31% | 1,706 | 79.34% | 7,393 | 2.35% | 219 | 9,318 |
| Jackson County | 32.24% | 17,299 | 66.62% | 35,747 | 1.14% | 609 | 53,655 |
| Jasper County | 54.57% | 5,097 | 44.89% | 4,193 | 0.54% | 50 | 9,340 |
| Jefferson County | 89.13% | 3,951 | 10.56% | 468 | 0.32% | 14 | 4,433 |
| Jefferson Davis County | 62.16% | 4,267 | 36.52% | 2,507 | 1.31% | 90 | 6,864 |
| Jones County | 30.54% | 9,211 | 68.59% | 20,687 | 0.87% | 261 | 30,159 |
| Kemper County | 64.11% | 3,239 | 35.41% | 1,789 | 0.48% | 24 | 5,052 |
| Lafayette County | 41.48% | 8,091 | 56.78% | 11,075 | 1.74% | 339 | 19,505 |
| Lamar County | 22.07% | 5,494 | 76.74% | 19,101 | 1.18% | 294 | 24,889 |
| Lauderdale County | 42.15% | 13,814 | 57.05% | 18,700 | 0.80% | 263 | 32,777 |
| Lawrence County | 36.85% | 2,468 | 62.59% | 4,192 | 0.57% | 38 | 6,698 |
| Leake County | 45.41% | 4,079 | 54.14% | 4,863 | 0.46% | 41 | 8,983 |
| Lee County | 35.58% | 12,563 | 63.49% | 22,415 | 0.93% | 328 | 35,306 |
| Leflore County | 71.39% | 9,119 | 28.08% | 3,587 | 0.52% | 67 | 12,773 |
| Lincoln County | 33.33% | 5,471 | 66.04% | 10,839 | 0.63% | 104 | 16,414 |
| Lowndes County | 49.30% | 13,388 | 49.78% | 13,518 | 0.93% | 252 | 27,158 |
| Madison County | 41.80% | 20,722 | 57.51% | 28,507 | 0.69% | 342 | 49,571 |
| Marion County | 34.51% | 4,393 | 64.71% | 8,237 | 0.78% | 99 | 12,729 |
| Marshall County | 59.42% | 9,650 | 39.86% | 6,473 | 0.72% | 117 | 16,240 |
| Monroe County | 41.71% | 7,056 | 57.47% | 9,723 | 0.82% | 139 | 16,918 |
| Montgomery County | 47.39% | 2,675 | 52.21% | 2,947 | 0.41% | 23 | 5,645 |
| Neshoba County | 28.04% | 3,089 | 71.15% | 7,837 | 0.81% | 89 | 11,015 |
| Newton County | 33.95% | 3,319 | 65.40% | 6,394 | 0.65% | 64 | 9,777 |
| Noxubee County | 78.54% | 4,920 | 21.15% | 1,325 | 0.30% | 19 | 6,264 |
| Oktibbeha County | 50.20% | 9,095 | 48.36% | 8,761 | 1.44% | 261 | 18,117 |
| Panola County | 53.96% | 9,079 | 45.34% | 7,629 | 0.70% | 118 | 16,826 |
| Pearl River County | 19.65% | 4,366 | 78.96% | 17,549 | 1.39% | 309 | 22,224 |
| Perry County | 26.69% | 1,527 | 72.30% | 4,137 | 1.01% | 58 | 5,722 |
| Pike County | 53.69% | 9,650 | 45.52% | 8,181 | 0.80% | 143 | 17,974 |
| Pontotoc County | 22.59% | 2,804 | 76.13% | 9,448 | 1.28% | 159 | 12,411 |
| Prentiss County | 28.08% | 2,817 | 70.52% | 7,075 | 1.41% | 141 | 10,033 |
| Quitman County | 71.30% | 2,837 | 28.05% | 1,116 | 0.65% | 26 | 3,979 |
| Rankin County | 23.37% | 14,988 | 75.52% | 48,444 | 1.11% | 713 | 64,145 |
| Scott County | 44.91% | 5,031 | 54.36% | 6,089 | 0.73% | 82 | 11,202 |
| Sharkey County | 70.38% | 1,782 | 29.11% | 737 | 0.51% | 13 | 2,532 |
| Simpson County | 38.56% | 4,723 | 60.61% | 7,424 | 0.83% | 102 | 12,249 |
| Smith County | 24.44% | 1,979 | 74.69% | 6,049 | 0.88% | 71 | 8,099 |
| Stone County | 26.59% | 2,003 | 71.96% | 5,420 | 1.45% | 109 | 7,532 |
| Sunflower County | 73.02% | 8,199 | 26.09% | 2,929 | 0.89% | 100 | 11,228 |
| Tallahatchie County | 60.88% | 3,959 | 38.43% | 2,499 | 0.69% | 45 | 6,503 |
| Tate County | 39.76% | 4,933 | 59.10% | 7,332 | 1.14% | 141 | 12,406 |
| Tippah County | 25.28% | 2,317 | 73.30% | 6,717 | 1.42% | 130 | 9,164 |
| Tishomingo County | 20.70% | 1,643 | 77.28% | 6,133 | 2.02% | 160 | 7,936 |
| Tunica County | 79.30% | 3,475 | 20.15% | 883 | 0.55% | 24 | 4,382 |
| Union County | 24.13% | 2,742 | 74.77% | 8,498 | 1.10% | 125 | 11,365 |
| Walthall County | 45.32% | 3,422 | 53.65% | 4,051 | 1.03% | 78 | 7,551 |
| Warren County | 50.42% | 10,786 | 48.89% | 10,457 | 0.69% | 148 | 21,391 |
| Washington County | 70.92% | 13,981 | 28.66% | 5,651 | 0.42% | 83 | 19,715 |
| Wayne County | 40.15% | 4,148 | 59.15% | 6,111 | 0.71% | 73 | 10,332 |
| Webster County | 22.74% | 1,190 | 76.27% | 3,992 | 0.99% | 52 | 5,234 |
| Wilkinson County | 70.31% | 3,412 | 29.16% | 1,415 | 0.54% | 26 | 4,853 |
| Winston County | 46.87% | 4,607 | 52.58% | 5,168 | 0.55% | 54 | 9,829 |
| Yalobusha County | 47.69% | 3,030 | 51.56% | 3,276 | 0.76% | 48 | 6,354 |
| Yazoo County | 56.82% | 6,603 | 42.52% | 4,941 | 0.65% | 76 | 11,620 |
Democratic primary
[Data unknown/missing.]
Republican primary
Mississippi Republican primary, 2012
|
| March 13, 2012 (2012-03-13) |
|
|
|
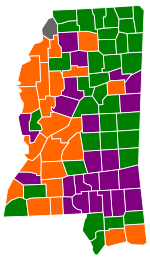 Mississippi results by county
Rick Santorum
Newt Gingrich
Mitt Romney
Tie |
The Republican primary took place on March 13, 2012, the same day as the Alabama Republican primary and the Hawaii Republican caucuses.[4][5] After the open election, 37 bound delegates and three unbound delegates will go to the Republican National Convention.[6]
External links
|
|---|
| Election timelines | |
|---|
| National polling | |
|---|
| State polling | |
|---|
| Fundraising | |
|---|
| Debates and forums | |
|---|
| Straw polls | |
|---|
| Major events | |
|---|
Caucuses
and primaries | |
|---|
| Results breakdown | |
|---|
National
conventions | |
|---|
| Reforms | |
|---|
.svg.png)