United States presidential election in Nebraska, 2012
|
|
|
|
|
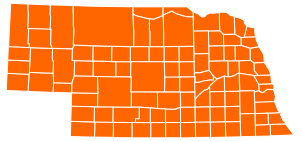
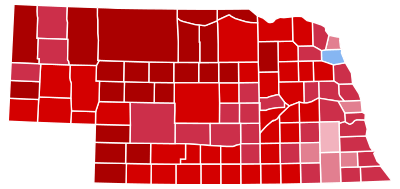 County Results
|
Romney
40-50%
50-60%
60-70%
70-80%
80-90%
|
Obama
50-60%
|
|
|
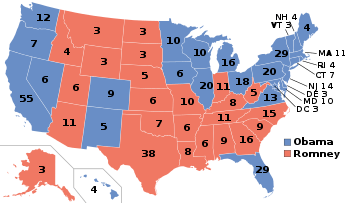
The 2012 United States presidential election in Nebraska took place on November 6, 2012, as part of the 2012 General Election in which all 50 states plus The District of Columbia participated. Nebraska voters chose five electors to represent them in the Electoral College via a popular vote pitting incumbent Democratic President Barack Obama and his running mate, Vice President Joe Biden, against Republican challenger and former Massachusetts Governor Mitt Romney and his running mate, Congressman Paul Ryan.
On election day, Mitt Romney carried the state of Nebraska, taking 59.80% of the vote to Barack Obama's 38.03%, a margin of 21.77%. Nebraska is one of two states (along with Maine) which splits its electoral votes based on the winner in each congressional district. In 2012, Romney won all 3 congressional districts, thus winning all 5 of the state's electoral votes. This was a change from 2008, when the state as a whole had voted for Republican John McCain but Democrat Barack Obama still won an electoral vote from the state. Nebraska's 2nd congressional district, home to Omaha, had split with the rest of the state and awarded one of Nebraska's electoral votes to a Democratic presidential nominee for the first time since 1964. Nebraska's 2nd congressional district, Indiana, and North Carolina were the only sources of electoral votes to change hands from Obama to the Republicans between 2008 and 2012.
General Election
Results By Congressional District
Romney won all three of Nebraska's congressional districts.[1]
| District |
Romney % |
Romney # |
Obama % |
Obama # |
Johnson % |
Johnson # |
Terry % |
Terry # |
Representative |
|---|
| 1st |
57.43% |
152,021 |
40.83% |
108,082 |
1.45% |
3,847 |
0.28% |
762 |
Jeff Fortenberry |
| 2nd |
52.85% |
140,976 |
45.70% |
121,889 |
1.27% |
3,393 |
0.18% |
469 |
Lee Terry |
| 3rd |
70.23% |
182,067 |
27.82% |
72,110 |
1.44% |
3,869 |
0.45% |
1,177 |
Adrian Smith |
By county
| County |
Romney |
Votes |
Obama |
Votes |
Others |
Votes |
Total |
| Adams | 65.98% | 8,316 | 32.23% | 4,062 | 1.79% | 226 | 12,604 |
| Antelope | 80.55% | 2,585 | 17.79% | 571 | 1.65% | 53 | 3,209 |
| Arthur | 86.97% | 227 | 11.49% | 30 | 1.53% | 4 | 261 |
| Banner | 84.56% | 345 | 13.48% | 55 | 1.96% | 8 | 408 |
| Blaine | 89.04% | 268 | 9.63% | 29 | 1.33% | 4 | 301 |
| Boone | 76.31% | 2,136 | 21.97% | 615 | 1.71% | 48 | 2,799 |
| Box Butte | 61.29% | 2,869 | 36.15% | 1,692 | 2.56% | 120 | 4,681 |
| Boyd | 81.51% | 873 | 17.55% | 188 | 0.93% | 10 | 1,071 |
| Brown | 84.01% | 1,298 | 14.43% | 223 | 1.55% | 24 | 1,545 |
| Buffalo | 69.76% | 13,570 | 27.58% | 5,365 | 2.66% | 518 | 19,453 |
| Burt | 60.31% | 2,016 | 38.29% | 1,280 | 1.41% | 47 | 3,343 |
| Butler | 71.48% | 2,729 | 26.93% | 1,028 | 1.60% | 61 | 3,818 |
| Cass | 62.36% | 7,453 | 35.96% | 4,298 | 1.68% | 201 | 11,952 |
| Cedar | 76.00% | 3,278 | 22.21% | 958 | 1.79% | 77 | 4,313 |
| Chase | 85.07% | 1,584 | 13.64% | 254 | 1.29% | 24 | 1,862 |
| Cherry | 83.78% | 2,557 | 14.29% | 436 | 1.93% | 59 | 3,052 |
| Cheyenne | 74.67% | 3,134 | 23.42% | 983 | 1.91% | 80 | 4,197 |
| Clay | 75.89% | 2,213 | 22.70% | 662 | 1.41% | 41 | 2,916 |
| Colfax | 66.96% | 2,051 | 31.64% | 969 | 1.40% | 43 | 3,063 |
| Cuming | 72.76% | 2,858 | 25.84% | 1,015 | 1.40% | 55 | 3,928 |
| Custer | 78.52% | 4,251 | 19.69% | 1,066 | 1.79% | 97 | 5,414 |
| Dakota | 51.00% | 3,048 | 47.36% | 2,831 | 1.64% | 98 | 5,977 |
| Dawes | 67.01% | 2,435 | 30.32% | 1,102 | 2.67% | 97 | 3,634 |
| Dawson | 69.93% | 5,369 | 28.08% | 2,156 | 1.99% | 153 | 7,678 |
| Deuel | 75.40% | 763 | 21.25% | 215 | 3.36% | 34 | 1,012 |
| Dixon | 65.45% | 1,745 | 32.63% | 870 | 1.91% | 51 | 2,666 |
| Dodge | 60.55% | 8,937 | 37.86% | 5,588 | 1.59% | 234 | 14,759 |
| Douglas | 51.44% | 109,579 | 47.17% | 100,475 | 1.39% | 2,957 | 213,011 |
| Dundy | 80.65% | 792 | 17.92% | 176 | 1.43% | 14 | 982 |
| Fillmore | 70.05% | 1,972 | 28.21% | 794 | 1.74% | 49 | 2,815 |
| Franklin | 72.69% | 1,110 | 24.95% | 381 | 2.36% | 36 | 1,527 |
| Frontier | 77.49% | 1,005 | 20.89% | 271 | 1.62% | 21 | 1,297 |
| Furnas | 79.77% | 1,767 | 19.05% | 422 | 1.17% | 26 | 2,215 |
| Gage | 57.27% | 5,470 | 40.52% | 3,870 | 2.22% | 212 | 9,552 |
| Garden | 76.19% | 829 | 22.24% | 242 | 1.56% | 17 | 1,088 |
| Garfield | 82.07% | 769 | 15.90% | 149 | 2.03% | 19 | 937 |
| Gosper | 75.13% | 734 | 23.54% | 230 | 1.33% | 13 | 977 |
| Grant | 88.71% | 322 | 8.26% | 30 | 3.03% | 11 | 363 |
| Greeley | 69.43% | 820 | 28.79% | 340 | 1.78% | 21 | 1,181 |
| Hall | 62.94% | 12,412 | 35.35% | 6,971 | 1.71% | 338 | 19,721 |
| Hamilton | 74.25% | 3,582 | 23.55% | 1,136 | 2.20% | 106 | 4,824 |
| Harlan | 78.79% | 1,248 | 19.63% | 311 | 1.58% | 25 | 1,584 |
| Hayes | 88.41% | 473 | 9.35% | 50 | 2.24% | 12 | 535 |
| Hitchcock | 79.02% | 1,175 | 18.29% | 272 | 2.69% | 40 | 1,487 |
| Holt | 79.79% | 3,789 | 18.15% | 862 | 2.06% | 98 | 4,749 |
| Hooker | 83.76% | 330 | 14.97% | 59 | 1.27% | 5 | 394 |
| Howard | 66.18% | 1,890 | 32.00% | 914 | 1.82% | 52 | 2,856 |
| Jefferson | 63.11% | 2,156 | 34.69% | 1,185 | 2.20% | 75 | 3,416 |
| Johnson | 59.46% | 1,223 | 38.41% | 790 | 2.14% | 44 | 2,057 |
| Kearney | 74.18% | 2,341 | 24.11% | 761 | 1.71% | 54 | 3,156 |
| Keith | 75.29% | 3,044 | 22.95% | 928 | 1.76% | 71 | 4,043 |
| Keya Paha | 81.50% | 392 | 16.63% | 80 | 1.87% | 9 | 481 |
| Kimball | 73.39% | 1,222 | 23.48% | 391 | 3.12% | 52 | 1,665 |
| Knox | 71.68% | 2,878 | 26.28% | 1,055 | 2.04% | 82 | 4,015 |
| Lancaster | 49.63% | 61,480 | 48.69% | 60,315 | 1.67% | 2,073 | 123,868 |
| Lincoln | 69.08% | 10,545 | 28.49% | 4,350 | 2.43% | 371 | 15,266 |
| Logan | 82.60% | 356 | 15.78% | 68 | 1.62% | 7 | 431 |
| Loup | 81.46% | 290 | 17.42% | 62 | 1.12% | 4 | 356 |
| Madison | 73.08% | 9,874 | 24.93% | 3,368 | 2.00% | 270 | 13,512 |
| McPherson | 81.72% | 237 | 14.14% | 41 | 4.14% | 12 | 290 |
| Merrick | 71.65% | 2,490 | 26.62% | 925 | 1.73% | 60 | 3,475 |
| Morrill | 77.11% | 1,681 | 20.87% | 455 | 2.02% | 44 | 2,180 |
| Nance | 68.45% | 1,098 | 29.74% | 477 | 1.81% | 29 | 1,604 |
| Nemaha | 63.31% | 1,979 | 34.84% | 1,089 | 1.86% | 58 | 3,126 |
| Nuckolls | 72.03% | 1,563 | 26.13% | 567 | 1.84% | 40 | 2,170 |
| Otoe | 61.20% | 4,226 | 36.81% | 2,542 | 1.98% | 137 | 6,905 |
| Pawnee | 67.44% | 897 | 29.77% | 396 | 2.78% | 37 | 1,330 |
| Perkins | 81.42% | 1,135 | 17.07% | 238 | 1.51% | 21 | 1,394 |
| Phelps | 77.91% | 3,372 | 20.22% | 875 | 1.87% | 81 | 4,328 |
| Pierce | 79.29% | 2,707 | 18.66% | 637 | 2.05% | 70 | 3,414 |
| Platte | 75.20% | 9,963 | 23.36% | 3,095 | 1.44% | 191 | 13,249 |
| Polk | 77.11% | 1,886 | 21.55% | 527 | 1.35% | 33 | 2,446 |
| Red Willow | 79.19% | 3,855 | 19.31% | 940 | 1.50% | 73 | 4,868 |
| Richardson | 65.41% | 2,407 | 32.07% | 1,180 | 2.53% | 93 | 3,680 |
| Rock | 85.39% | 672 | 13.09% | 103 | 1.52% | 12 | 787 |
| Saline | 52.11% | 2,518 | 46.19% | 2,232 | 1.70% | 82 | 4,832 |
| Sarpy | 60.93% | 40,318 | 37.34% | 24,709 | 1.72% | 1,139 | 66,166 |
| Saunders | 65.91% | 6,725 | 32.14% | 3,279 | 1.95% | 199 | 10,203 |
| Scotts Bluff | 67.98% | 9,427 | 30.24% | 4,193 | 1.78% | 247 | 13,867 |
| Seward | 66.46% | 5,003 | 31.70% | 2,386 | 1.85% | 139 | 7,528 |
| Sheridan | 82.09% | 2,021 | 15.84% | 390 | 2.07% | 51 | 2,462 |
| Sherman | 60.94% | 919 | 36.41% | 549 | 2.65% | 40 | 1,508 |
| Sioux | 84.76% | 623 | 13.74% | 101 | 1.50% | 11 | 735 |
| Stanton | 74.15% | 1,945 | 23.14% | 607 | 2.71% | 71 | 2,623 |
| Thayer | 70.54% | 1,853 | 27.56% | 724 | 1.90% | 50 | 2,627 |
| Thomas | 88.24% | 360 | 10.29% | 42 | 1.47% | 6 | 408 |
| Thurston | 41.29% | 823 | 57.85% | 1,153 | 0.85% | 17 | 1,993 |
| Valley | 75.78% | 1,643 | 22.79% | 494 | 1.43% | 31 | 2,168 |
| Washington | 67.75% | 6,857 | 30.66% | 3,103 | 1.59% | 161 | 10,121 |
| Wayne | 68.13% | 2,493 | 29.35% | 1,074 | 2.51% | 92 | 3,659 |
| Webster | 72.54% | 1,255 | 25.43% | 440 | 2.02% | 35 | 1,730 |
| Wheeler | 77.35% | 345 | 20.85% | 93 | 1.79% | 8 | 446 |
| York | 77.08% | 4,815 | 21.64% | 1,352 | 1.28% | 80 | 6,247 |
Democratic primary
The Democratic primary was not held as Barack Obama ran unopposed and had secured enough delegates for nomination.[2]
Republican primary
Nebraska Republican primary, 2012
|
| May 15, 2012 (2012-05-15) |
|
|
|
 Nebraska results by county
Mitt Romney
(Note: Italicization indicates a withdrawn candidacy) |
| Elections in Nebraska |
|---|
 |
|
|
|
Gubernatorial Elections |
|---|
|
|
|
State Legislature Elections |
|---|
|
|
|
General elections |
|---|
|
|
|
|
|
|
|
|
The Republican primary was on May 15, 2012.[3] This primary was purely of an advisory nature. From June 1 to June 10 caucuses county conventions caucused to elect delegates to the state convention. These delegates were not bound to vote for any candidate, but at the state convention on July 14, elected 32 bound National delegates. 3 party leaders attended the National Convention unbound, making a total of 35 voting delegates going to the national convention from Nebraska.
| Nebraska Republican primary, 2012 |
| Candidate |
Votes |
Percentage |
Delegates |
| Mitt Romney |
131,436 |
70.89% |
30 |
| Rick Santorum |
25,830 |
13.93% |
0 |
| Ron Paul |
18,508 |
9.98% |
2 |
| Newt Gingrich |
9,628 |
5.19% |
0 |
| Unpledged delegates: |
3 |
| Total: |
185,402 |
100.0% |
35 |
| Key: | Withdrew prior to contest |
Convention
The State Convention was held in Grand Island on July 14, 2012.
| Convention Results[4][5] |
|---|
| Candidate |
1st |
2nd |
3rd |
State |
Party
leaders |
Total |
 Mitt Romney Mitt Romney |
3 |
1 |
3 |
23 |
2 |
32 |
| Ron Paul |
0 |
2 |
0 |
0 |
0 |
2 |
| Unknown |
0 |
0 |
0 |
0 |
1 |
1 |
| Total |
9 |
23 |
3 |
35 |
External links
|
|---|
| Election timelines | |
|---|
| National polling | |
|---|
| State polling | |
|---|
| Fundraising | |
|---|
| Debates and forums | |
|---|
| Straw polls | |
|---|
| Major events | |
|---|
Caucuses
and primaries | |
|---|
| Results breakdown | |
|---|
National
conventions | |
|---|
| Reforms | |
|---|