United States presidential election in West Virginia, 2012
|
| ||||||||||||||||||||||||||
| ||||||||||||||||||||||||||
| ||||||||||||||||||||||||||
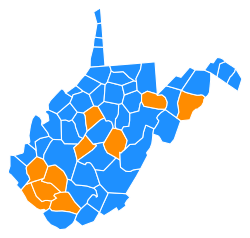
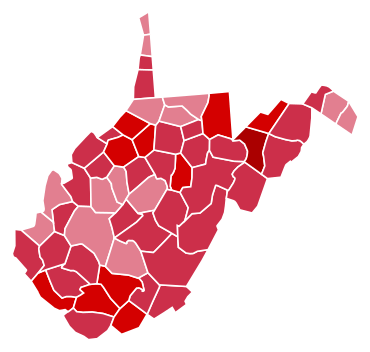 County Results
Romney 50-60% 60-70% 70-80% 80-90%
| ||||||||||||||||||||||||||
| ||||||||||||||||||||||||||
| Elections in West Virginia | ||||||||||
|---|---|---|---|---|---|---|---|---|---|---|
 | ||||||||||
|
Federal elections
|
||||||||||
Part of a series on the 2012 U.S. presidential election |
|---|
| Democratic Party |
| Republican Party |
| Related races |
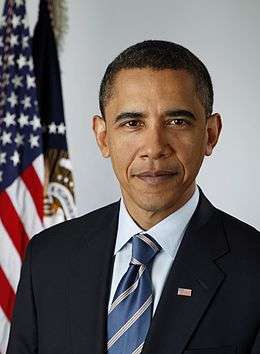
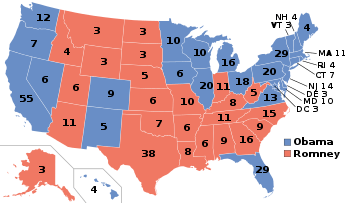
The 2012 United States presidential election in West Virginia took place on November 6, 2012, as part of the 2012 General Election in which all 50 states plus The District of Columbia participated. West Virginia voters chose five electors to represent them in the Electoral College via a popular vote pitting incumbent Democratic President Barack Obama and his running mate, Vice President Joe Biden, against Republican challenger and former Massachusetts Governor Mitt Romney and his running mate, Congressman Paul Ryan.
On election day, Mitt Romney defeated Barack Obama in the state of West Virginia by a landslide 26.76% margin. The Republican ticket took 62.30% of the vote to the Democratic ticket's 35.54%, and also swept every county in the state.[1] Romney became the first presidential candidate from any party since West Virginia's admission to the Union in 1863 to sweep every single county in the state and the first Republican candidate since Richard Nixon in 1972 to carry over 60% of the state's votes.[2] This represented a historic loss for the Democrats in West Virginia, which had been a Democratic stronghold from the New Deal up through the 1990s.
With 62.14% of the popular vote, West Virginia would prove to be Romney's fifth strongest state in the 2012 election after Utah, Wyoming, Oklahoma and Idaho.[3]
General Election
Results
| United States presidential election in West Virginia, 2012 | ||||||
|---|---|---|---|---|---|---|
| Party | Candidate | Running mate | Votes | Percentage | Electoral votes | |
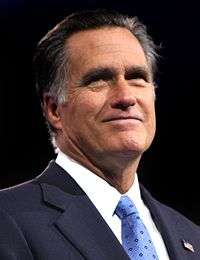
| Republican | Mitt Romney | Paul Ryan | 417,655 | 62.30% | 5 | |
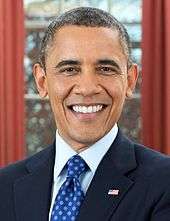
| Democratic | Barack Obama | Joe Biden | 238,269 | 35.54% | 0 | |
| Libertarian | Gary Johnson | Jim Gray | 6,302 | 0.94% | 0 | |
| Mountain (Green) | Jill Stein | Cheri Honkala | 4,406 | 0.66% | 0 | |
| No Affiliation | Randall Terry | 3,806 | 0.57% | 0 | ||
| Totals | 670,438 | 100.00% | 5 | |||
By county
| County | Obama% | Obama# | Romney% | Romney# | Others% | Others# | Total |
|---|---|---|---|---|---|---|---|
| Barbour County | 30.69% | 1,768 | 66.38% | 3,824 | 2.93% | 169 | 5,761 |
| Berkeley County | 38.40% | 14,275 | 59.60% | 22,156 | 1.99% | 741 | 37,172 |
| Boone County | 32.82% | 2,790 | 64.32% | 5,467 | 2.86% | 243 | 8,500 |
| Braxton County | 41.59% | 1,998 | 56.72% | 2,725 | 1.69% | 81 | 4,804 |
| Brooke County | 43.09% | 4,005 | 54.44% | 5,060 | 2.46% | 229 | 9,294 |
| Cabell County | 42.21% | 13,568 | 55.95% | 17,985 | 1.84% | 591 | 32,144 |
| Calhoun County | 37.06% | 818 | 59.76% | 1,319 | 3.17% | 70 | 2,207 |
| Clay County | 30.91% | 931 | 65.44% | 1,971 | 3.65% | 110 | 3,012 |
| Doddridge County | 20.77% | 575 | 76.92% | 2,130 | 2.31% | 64 | 2,769 |
| Fayette County | 38.51% | 5,419 | 59.35% | 8,350 | 2.14% | 301 | 14,070 |
| Gilmer County | 33.48% | 840 | 63.57% | 1,595 | 2.95% | 74 | 2,509 |
| Grant County | 15.66% | 718 | 82.49% | 3,783 | 1.85% | 85 | 4,586 |
| Greenbrier County | 36.33% | 4,710 | 61.17% | 7,930 | 2.49% | 323 | 12,963 |
| Hampshire County | 28.79% | 2,299 | 69.16% | 5,523 | 2.05% | 164 | 7,986 |
| Hancock County | 38.18% | 4,627 | 59.63% | 7,226 | 2.19% | 265 | 12,118 |
| Hardy County | 28.68% | 1,482 | 68.42% | 3,536 | 2.90% | 150 | 5,168 |
| Harrison County | 37.22% | 9,732 | 60.72% | 15,876 | 2.06% | 539 | 26,147 |
| Jackson County | 33.39% | 3,854 | 64.17% | 7,408 | 2.44% | 282 | 11,544 |
| Jefferson County | 46.97% | 10,398 | 50.85% | 11,258 | 2.18% | 482 | 22,138 |
| Kanawha County | 43.26% | 32,480 | 55.10% | 41,364 | 1.64% | 1,233 | 75,077 |
| Lewis County | 27.61% | 1,736 | 69.59% | 4,375 | 2.80% | 176 | 6,287 |
| Lincoln County | 32.66% | 2,227 | 64.29% | 4,383 | 3.05% | 208 | 6,818 |
| Logan County | 29.04% | 3,469 | 68.83% | 8,222 | 2.13% | 255 | 11,946 |
| Marion County | 41.59% | 8,959 | 55.96% | 12,054 | 2.46% | 529 | 21,542 |
| Marshall County | 34.72% | 4,484 | 62.98% | 8,135 | 2.30% | 297 | 12,916 |
| Mason County | 38.59% | 3,778 | 58.65% | 5,741 | 2.76% | 270 | 9,789 |
| McDowell County | 34.08% | 2,109 | 63.98% | 3,959 | 1.94% | 120 | 6,188 |
| Mercer County | 25.53% | 5,432 | 72.62% | 15,450 | 1.85% | 394 | 21,276 |
| Mineral County | 26.28% | 2,885 | 71.35% | 7,833 | 2.38% | 261 | 10,979 |
| Mingo County | 27.50% | 2,428 | 70.11% | 6,191 | 2.39% | 211 | 8,830 |
| Monongalia County | 43.93% | 13,826 | 53.47% | 16,831 | 2.60% | 818 | 31,475 |
| Monroe County | 27.92% | 1,455 | 69.38% | 3,616 | 2.71% | 141 | 5,212 |
| Morgan County | 33.55% | 2,363 | 64.07% | 4,513 | 2.39% | 168 | 7,044 |
| Nicholas County | 30.32% | 2,664 | 67.14% | 5,898 | 2.54% | 223 | 8,785 |
| Ohio County | 37.89% | 6,786 | 60.12% | 10,768 | 1.99% | 357 | 17,911 |
| Pendleton County | 33.16% | 1,074 | 64.68% | 2,095 | 2.16% | 70 | 3,239 |
| Pleasants County | 33.63% | 955 | 64.26% | 1,825 | 2.11% | 60 | 2,840 |
| Pocahontas County | 36.44% | 1,303 | 61.02% | 2,182 | 2.54% | 91 | 3,576 |
| Preston County | 26.28% | 2,931 | 70.72% | 7,889 | 3.0% | 335 | 11,155 |
| Putnam County | 30.65% | 7,256 | 67.72% | 16,032 | 1.63% | 385 | 23,673 |
| Raleigh County | 26.84% | 7,739 | 71.50% | 20,614 | 1.65% | 476 | 28,829 |
| Randolph County | 34.26% | 3,342 | 63.15% | 6,160 | 2.58% | 252 | 9,754 |
| Ritchie County | 20.27% | 768 | 77.11% | 2,921 | 2.61% | 99 | 3,788 |
| Roane County | 38.42% | 1,939 | 59.08% | 2,982 | 2.50% | 126 | 5,047 |
| Summers County | 34.23% | 1,621 | 62.96% | 2,981 | 2.81% | 133 | 4,735 |
| Taylor County | 32.85% | 1,941 | 65.00% | 3,840 | 2.15% | 127 | 5,908 |
| Tucker County | 28.04% | 880 | 69.34% | 2,176 | 2.61% | 82 | 3,138 |
| Tyler County | 27.14% | 890 | 70.57% | 2,314 | 2.29% | 75 | 3,279 |
| Upshur County | 26.08% | 2,158 | 71.79% | 5,939 | 2.13% | 176 | 8,273 |
| Wayne County | 35.34% | 4,931 | 62.26% | 8,688 | 2.41% | 336 | 13,955 |
| Webster County | 34.37% | 947 | 62.07% | 1,710 | 3.56% | 98 | 2,755 |
| Wetzel County | 37.86% | 2,217 | 59.31% | 3,473 | 2.83% | 166 | 5,856 |
| Wirt County | 31.14% | 676 | 65.73% | 1,427 | 3.13% | 68 | 2,171 |
| Wood County | 33.05% | 11,230 | 65.29% | 22,183 | 1.66% | 564 | 33,977 |
| Wyoming County | 21.04% | 1,583 | 76.68% | 5,769 | 2.27% | 171 | 7,523 |
Democratic primary
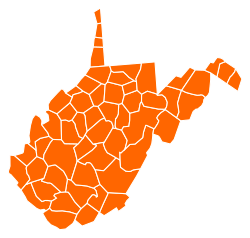
Barack Obama defeated Keith Judd, a convicted felon serving a federal prison sentence in Texarkana, TX, by a surprisingly narrow 59% to 41%.[4]
|
| |||||||||||||||||||
| |||||||||||||||||||
| |||||||||||||||||||
 West Virginia results by county
Barack Obama
Keith Judd | |||||||||||||||||||
Republican primary
The Republican primary took place on May 8, 2012.[5][6]
| West Virginia Republican primary, 2012[7] | |||||||
|---|---|---|---|---|---|---|---|
| Candidate | Votes | Percentage | Projected delegate count | ||||
| CNN | GP | ||||||
| 78,197 | 69.56% | 24 | |||||
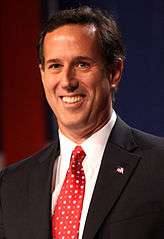
| Rick Santorum (withdrawn) | 13,590 | 12.09% | 2 | ||||
| Ron Paul | 12,412 | 11.04% | 0 | ||||
| Newt Gingrich (withdrawn) | 7,076 | 6.29% | 0 | ||||
| Buddy Roemer (withdrawn) | 1,141 | 1.01% | 0 | ||||
| Unprojected delegates | 31 | 5 | |||||
| Total: | 112,416 | 100% | 31 | 31 | |||
|
| |||||||||||||||||||||||||||||||||||||||||
| |||||||||||||||||||||||||||||||||||||||||
| |||||||||||||||||||||||||||||||||||||||||
 West Virginia results by county
Mitt Romney
(Note: Italicization indicates a withdrawn candidacy) | |||||||||||||||||||||||||||||||||||||||||

| County | Mitt Romney | Ron Paul | Rick Santorum (withdrawn) |
Newt Gingrich (withdrawn) |
Buddy Roemer (withdrawn) |
|---|---|---|---|---|---|
| Barbour | 66.96% (983) | 9.20% (135) | 15.94% (234) | 7.49% (110) | 0.41% (6) |
| Berkeley | 69.31% (4366) | 14.92% (940) | 10.29% (648) | 4.84% (305) | 0.64% (40) |
| Boone | 70.28% (454) | 10.68% (69) | 14.55% (94) | 3.41% (22) | 1.08% (7) |
| Braxton | 68.44% (399) | 13.89% (81) | 12.35% (72) | 4.12% (24) | 1.20% (7) |
| Brooke | 69.46% (778) | 10.36% (116) | 15.09% (169) | 4.64% (52) | 0.45% (5) |
| Cabell | 69.09% (3351) | 12.60% (611) | 11.34% (550) | 5.77% (280) | 1.20% (58) |
| Calhoun | 66.78% (191) | 11.89% (34) | 12.24% (35) | 5.59% (16) | 3.50% (10) |
| Clay | 67.01% (262) | 10.49% (41) | 13.30% (52) | 7.42% (29) | 1.79% (7) |
| Doddridge | 67.36% (997) | 10.61% (157) | 12.23% (181) | 8.31% (123) | 1.49% (22) |
| Fayette | 66.54% (891) | 12.02% (161) | 12.70% (170) | 7.17% (96) | 1.57% (21) |
| Gilmer | 70.44% (255) | 7.73% (28) | 11.05% (40) | 9.94% (36) | 0.83% (3) |
| Grant | 78.16% (1403) | 6.07% (109) | 8.30% (149) | 6.35% (114) | 1.11% (20) |
| Greenbrier | 68.13% (1366) | 11.12% (223) | 13.12% (263) | 6.43% (129) | 1.20% (24) |
| Hampshire | 72.70% (1270) | 8.59% (150) | 12.08% (211) | 5.72% (100) | 0.92% (16) |
| Hancock | 70.04% (1302) | 11.62% (216) | 13.07% (243) | 3.98% (74) | 1.29% (24) |
| Hardy | 69.75% (611) | 8.22% (72) | 13.93% (122) | 6.62% (58) | 1.48% (13) |
| Harrison | 67.88% (2715) | 10.95% (438) | 12.03% (481) | 8.25% (330) | 0.90% (36) |
| Jackson | 65.87% (2030) | 11.36% (350) | 13.98% (431) | 7.66% (236) | 1.14% (35) |
| Jefferson | 67.98% (1771) | 16.08% (419) | 10.13% (264) | 4.99% (130) | 0.81% (21) |
| Kanawha | 71.73% (7295) | 11.62% (1182) | 10.55% (1073) | 5.18% (527) | 0.91% (93) |
| Lewis | 73.98% (1288) | 7.41% (129) | 10.17% (177) | 7.35% (128) | 1.09% (19) |
| Lincoln | 71.69% (504) | 8.53% (60) | 10.38% (73) | 7.54% (53) | 1.85% (13) |
| Logan | 67.71% (388) | 9.77% (56) | 15.01% (86) | 6.46% (37) | 1.05% (6) |
| Marion | 64.57% (1775) | 11.13% (306) | 15.61% (429) | 6.91% (190) | 1.78% (49) |
| Marshall | 71.67% (1687) | 8.54% (201) | 13.04% (307) | 5.82% (137) | 0.93% (22) |
| Mason | 66.04% (1641) | 11.11% (276) | 13.48% (335) | 7.69% (191) | 1.69% (42) |
| McDowell | 62.81% (152) | 12.81% (31) | 15.70% (38) | 8.26% (20) | 0.41% (1) |
| Mercer | 72.24% (1884) | 8.51% (222) | 12.08% (315) | 6.40% (167) | 0.77% (20) |
| Mineral | 70.54% (1722) | 10.00% (244) | 12.04% (294) | 6.72% (164) | 0.70% (17) |
| Mingo | 69.21% (272) | 7.63% (30) | 12.21% (48) | 8.91% (35) | 2.04% (8) |
| Monongalia | 66.40% (2826) | 14.14% (602) | 11.63% (495) | 6.72% (286) | 1.10% (47) |
| Monroe | 65.27% (671) | 12.55% (129) | 12.16% (125) | 8.46% (87) | 1.56% (16) |
| Morgan | 68.77% (1240) | 13.09% (236) | 11.09% (200) | 5.60% (101) | 1.44% (26) |
| Nicholas | 69.78% (875) | 9.81% (123) | 12.28% (154) | 7.10% (89) | 1.04% (13) |
| Ohio | 76.43% (2775) | 8.84% (321) | 10.52% (382) | 3.58% (130) | 0.63% (23) |
| Pendleton | 75.64% (354) | 7.26% (34) | 11.54% (54) | 4.70% (22) | 0.85% (4) |
| Pleasants | 66.26% (381) | 10.78% (62) | 16.70% (96) | 5.57% (32) | 0.70% (4) |
| Pocahontas | 63.05% (558) | 14.01% (124) | 13.56% (120) | 8.47% (75) | 0.90% (8) |
| Preston | 66.95% (2032) | 10.48% (318) | 15.32% (465) | 6.39% (194) | 0.86% (26) |
| Putnam | 70.34% (3891) | 11.26% (623) | 12.26% (678) | 5.28% (292) | 0.87% (48) |
| Raleigh | 73.23% (2992) | 7.73% (316) | 11.75% (480) | 6.78% (277) | 0.51% (21) |
| Randolph | 68.43% (969) | 9.25% (131) | 13.14% (186) | 7.84% (111) | 1.34% (19) |
| Ritchie | 65.27% (1000) | 13.97% (214) | 12.01% (184) | 7.18% (110) | 1.57% (24) |
| Roane | 69.95% (866) | 9.94% (123) | 11.31% (140) | 7.43% (92) | 1.37% (17) |
| Summers | 67.24% (388) | 10.40% (60) | 11.96% (69) | 9.01% (52) | 1.39% (8) |
| Taylor | 67.82% (784) | 11.76% (136) | 12.63% (146) | 7.44% (86) | 0.35% (4) |
| Tucker | 69.29% (422) | 11.33% (69) | 9.85% (60) | 9.03% (55) | 0.49% (3) |
| Tyler | 68.46% (675) | 11.76% (116) | 11.97% (118) | 6.39% (63) | 1.42% (14) |
| Upshur | 69.12% (2344) | 9.20% (312) | 13.65% (463) | 6.69% (227) | 1.33% (45) |
| Wayne | 66.79% (1076) | 10.12% (163) | 14.65% (236) | 7.76% (125) | 0.68% (11) |
| Webster | 64.65% (139) | 10.70% (23) | 15.35% (33) | 6.98% (15) | 2.33% (5) |
| Wetzel | 69.53% (566) | 8.35% (68) | 16.46% (134) | 5.28% (43) | 0.37% (3) |
| Wirt | 63.00% (332) | 11.57% (61) | 16.32% (86) | 8.92% (47) | 0.19% (1) |
| Wood | 70.20% (5422) | 11.64% (899) | 10.72% (828) | 6.42% (496) | 1.02% (79) |
| Wyoming | 75.58% (616) | 7.61% (62) | 9.08% (74) | 6.87% (56) | 0.86% (7) |
See also
References
- ↑ "WV Secretary of State". Retrieved January 3, 2013.
- ↑ Thomas, G. Scott; The Pursuit of the White House: A Handbook of Presidential Election Statistics and History, pp. 459-460 ISBN 0313257957
- ↑ "2012 Presidential Election Statistics". Dave Leip's Atlas of U.S. Presidential Elections. Retrieved 2018-03-05.
- ↑ http://www.cbsnews.com/8301-503544_162-57430719-503544/4-in-10-choose-convict-over-obama-in-w.va-primary/
- ↑ "Primary and Caucus Printable Calendar". CNN. Retrieved January 12, 2012.
- ↑ "Presidential Primary Dates" (PDF). Federal Election Commission. Retrieved January 23, 2012.
- ↑ Secretary of State official results
- ↑ "WV SOS Election Results Center". May 8, 2012. Retrieved August 29, 2012.
External links
- The Green Papers: for West Virginia
- The Green Papers: Major state elections in chronological order
State results of the 2012 U.S. presidential election | ||
|---|---|---|
|  | |
| ||