United States presidential election in Idaho, 2012
|
|
|
|
|
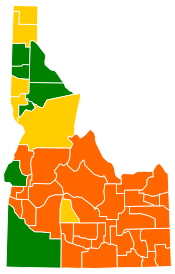
 County Results
|
Romney
50-60%
60-70%
70-80%
80-90%
>90%
|
Obama
40-50%
50-60%
|
|
|
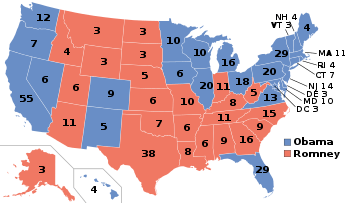
The 2012 United States presidential election in Idaho took place on November 6, 2012, as part of the 2012 General Election in which all 50 states plus The District of Columbia participated. Idaho voters chose four electors to represent them in the Electoral College via a popular vote pitting incumbent Democratic President Barack Obama and his running mate, Vice President Joe Biden, against Republican challenger and former Massachusetts Governor Mitt Romney and his running mate, Congressman Paul Ryan. Prior to the election, 17 news organizations considered this a state Romney would win, or otherwise considered as a safe red state. Romney and Ryan carried Idaho with 64.09% of the popular vote to Obama's and Biden's 32.40%, thus winning the state's four electoral votes.[1]Romney's victory in Idaho made it his fourth strongest state in the 2012 election after Utah, Wyoming and Oklahoma[2].
General election
Candidate Ballot Access:
- Mitt Romney/Paul Ryan, Republican
- Barack Obama/Joseph Biden, Democratic
- Gary Johnson/James P. Gray, Libertarian
- Jill Stein/Cheri Honkala, Green
- Virgil Goode/Jim Clymer, Constitution
- Rocky Anderson/Luis J. Rodriguez, Justice
By county
| County |
Obama% |
Obama# |
Romney% |
Romney# |
Others% |
Others# |
Total |
| Ada County | 42.72% | 77,137 | 54.03% | 97,554 | 3.24% | 5,855 | 180,546 |
| Adams County | 28.01% | 577 | 68.59% | 1,413 | 3.40% | 70 | 2,060 |
| Bannock County | 37.48% | 13,214 | 59.59% | 21,010 | 2.94% | 1,036 | 35,260 |
| Bear Lake County | 10.70% | 302 | 88.20% | 2,489 | 1.10% | 31 | 2,822 |
| Benewah County | 29.97% | 1,164 | 66.84% | 2,596 | 3.19% | 124 | 3,884 |
| Bingham County | 21.71% | 3,822 | 76.35% | 13,440 | 1.94% | 341 | 17,603 |
| Blaine County | 58.78% | 5,992 | 38.64% | 3,939 | 2.58% | 263 | 10,194 |
| Boise County | 30.57% | 1,053 | 66.30% | 2,284 | 3.13% | 108 | 3,445 |
| Bonner County | 35.07% | 6,500 | 61.32% | 11,367 | 3.61% | 669 | 18,536 |
| Bonneville County | 22.92% | 9,903 | 74.69% | 32,276 | 2.39% | 1,034 | 43,213 |
| Boundary County | 26.96% | 1,225 | 69.06% | 3,138 | 3.98% | 181 | 4,544 |
| Butte County | 20.06% | 258 | 77.84% | 1,001 | 2.10% | 27 | 1,286 |
| Camas County | 27.51% | 159 | 69.55% | 402 | 2.94% | 17 | 578 |
| Canyon County | 30.06% | 19,866 | 67.13% | 44,369 | 2.81% | 1,855 | 66,090 |
| Caribou County | 12.65% | 386 | 85.45% | 2,608 | 1.90% | 58 | 3,052 |
| Cassia County | 13.08% | 1,098 | 85.21% | 7,154 | 1.72% | 144 | 8,396 |
| Clark County | 20.12% | 66 | 71.65% | 235 | 8.23% | 27 | 328 |
| Clearwater County | 27.92% | 1,032 | 68.75% | 2,541 | 3.33% | 123 | 3,696 |
| Custer County | 22.53% | 530 | 74.15% | 1,744 | 3.32% | 78 | 2,352 |
| Elmore County | 31.41% | 2,513 | 65.33% | 5,227 | 3.26% | 261 | 8,001 |
| Franklin County | 05.80% | 325 | 92.77% | 5,195 | 1.43% | 80 | 5,600 |
| Fremont County | 13.96% | 810 | 84.57% | 4,907 | 1.47% | 85 | 5,802 |
| Gem County | 26.13% | 1,957 | 70.91% | 5,311 | 2.96% | 222 | 7,490 |
| Gooding County | 25.15% | 1,287 | 72.22% | 3,696 | 2.64% | 135 | 5,118 |
| Idaho County | 21.79% | 1,708 | 75.55% | 5,921 | 2.65% | 208 | 7,837 |
| Jefferson County | 11.45% | 1,303 | 86.94% | 9,895 | 1.61% | 183 | 11,381 |
| Jerome County | 25.43% | 1,699 | 71.91% | 4,804 | 2.66% | 178 | 6,681 |
| Kootenai County | 31.51% | 18,851 | 65.82% | 39,381 | 2.67% | 1,596 | 59,828 |
| Latah County | 49.56% | 8,306 | 45.28% | 7,589 | 5.16% | 864 | 16,759 |
| Lemhi County | 23.36% | 960 | 73.70% | 3,029 | 2.94% | 121 | 4,110 |
| Lewis County | 24.54% | 396 | 72.68% | 1,173 | 2.79% | 45 | 1,614 |
| Lincoln County | 28.22% | 469 | 68.65% | 1,141 | 3.13% | 52 | 1,662 |
| Madison County | 05.77% | 832 | 93.29% | 13,445 | 0.94% | 135 | 14,412 |
| Minidoka County | 19.93% | 1,390 | 78.04% | 5,442 | 2.02% | 141 | 6,973 |
| Nez Perce County | 38.29% | 6,451 | 59.16% | 9,967 | 2.55% | 430 | 16,848 |
| Oneida County | 10.39% | 217 | 87.98% | 1,838 | 1.63% | 34 | 2,089 |
| Owyhee County | 22.37% | 833 | 75.03% | 2,794 | 2.60% | 97 | 3,724 |
| Payette County | 26.73% | 2,271 | 70.68% | 6,004 | 2.59% | 220 | 8,495 |
| Power County | 33.83% | 982 | 64.42% | 1,870 | 1.76% | 51 | 2,903 |
| Shoshone County | 44.23% | 2,277 | 52.43% | 2,699 | 3.34% | 172 | 5,148 |
| Teton County | 42.58% | 1,926 | 54.34% | 2,458 | 3.07% | 139 | 4,523 |
| Twin Falls County | 26.80% | 7,541 | 70.26% | 19,773 | 2.94% | 828 | 28,142 |
| Valley County | 42.59% | 2,095 | 54.16% | 2,664 | 3.25% | 160 | 4,919 |
| Washington County | 25.50% | 1,104 | 72.24% | 3,128 | 2.26% | 98 | 4,330 |
Democratic caucuses
President Obama ran alone in the caucuses. The District cast all 31 of its delegate votes at the 2012 Democratic National Convention for Obama.[3]
| Idaho Democratic primary, 2012[4] |
|---|
| Candidate |
State convention delegates |
Percentage |
Delegates |
| Barack Obama |
1,400 |
100% |
27 |
| Unpledged delegates: |
4 |
| Total: |
1,400 |
100% |
31 |
Republican caucuses
Idaho Republican caucuses, 2012
|
| March 6, 2012 (2012-03-06) |
|
|
|
 Idaho results by county
Mitt Romney
Rick Santorum
Ron Paul |
| Elections in Idaho |
|---|
 |
|
Presidential elections |
|---|
|
|
|
Presidential primaries |
|---|
|
|
|
U.S. Senate elections |
|---|
|
|
|
U.S. House elections |
|---|
|
|
|
|
|
|
|
|
The Republican caucuses took place on Super Tuesday, March 6, 2012.[5][6] An advisory primary with no binding effect on delegates, scheduled to be held on Tuesday May 15, 2012, was cancelled by the Idaho Republican Party.[7] Five candidates were on the ballot. In order of filing they are Ron Paul, Mitt Romney, Rick Santorum, Newt Gingrich, and Buddy Roemer. Although Roemer had withdrawn from the Republican race before the Idaho caucus, he still appeared on the ballot.[8]
Idaho has 32 delegates to the Republican national convention, of which 3 are RNC and 29 are AL. The 3 RNC delegates pledged to go with the results of the Boise Straw Poll. The delegates will be determined by the caucuses results, based on a two-step approach. First, the delegates are primarily awarded winner-take-all by county after a series of votes in which candidates are successively removed from the ballot. Then, if a candidate receives half or more of the county delegates, he will receive all the 32 delegates; if not, the delegates will be split proportionately according to the number of county delegates.[9] Mitt Romney won 61% of the vote, thanks to a large majority of support (80-90% in most counties) in majority Mormon southeastern Idaho, rendering it a winner-take-all contest. Santorum and Paul split the Panhandle, winning five counties each, but came away empty in the delegate count.
Straw polls
Despite a complete lack of formal polling in the state,[9] there were a total of five straw polls conducted in Idaho, three of which were online. Ron Paul won three of these,[10][11][12] while Mitt Romney won two.[13]
January 2–4 online poll
This was the first ever Idaho straw poll.[14]It was conducted entirely online by Kaz Wittig KStar Enterprises. Ron Paul won with over 70 percent of the vote.[10]
January 6 Boise poll
This poll used paper ballots and was conducted in Boise. Ron Paul won this poll. Rick Perry's campaign, although still active in the race at this time, did not participate.[11]
February 2–4 online poll
This online straw poll was also produced by Kaz Wittig KStar Enterprises. Mitt Romney won the poll by a small margin.[13]
March 1–3 online poll
This poll was also produced by Kaz Wittig KStar Enterprises. Ron Paul won by a double-digit margin.[12]
Results
Results:[15][16]
County totals
| County | Newt Gingrich | Ron Paul | Mitt Romney | Rick Santorum | Total | Winner |
| Ada | 307 | 1766 | 4233 | 1866 | 8172 | Romney |
| Adams | 0 | 85 | 132 | 0 | 217 | Romney |
| Bannock | 24 | 254 | 1614 | 146 | 2038 | Romney |
| Bear Lake | 2 | 15 | 308 | 19 | 344 | Romney |
| Benewah | 24 | 90 | 26 | 145 | 265 | Santorum |
| Bingham | 27 | 215 | 2172 | 150 | 2564 | Romney |
| Blaine | 47 | 79 | 230 | 23 | 379 | Romney |
| Boise | 0 | 128 | 163 | 0 | 291 | Romney |
| Bonner | 0 | 555 | 0 | 487 | 1042 | Paul |
| Bonneville | 65 | 481 | 3044 | 235 | 3825 | Romney |
| Boundary | 0 | 193 | 64 | 101 | 358 | Paul |
| Butte | 10 | 25 | 153 | 23 | 211 | Romney |
| Camas | 0 | 40 | 38 | 0 | 78 | Paul |
| Canyon | 0 | 617 | 2056 | 1296 | 3969 | Romney |
| Caribou | 7 | 22 | 336 | 26 | 391 | Romney |
| Cassia | 28 | 143 | 1279 | 144 | 1594 | Romney |
| Clark | 2 | 8 | 88 | 17 | 115 | Romney |
| Clearwater | 0 | 85 | 0 | 151 | 236 | Santorum |
| Custer | 19 | 48 | 98 | 24 | 189 | Romney |
| Elmore | 0 | 158 | 281 | 0 | 439 | Romney |
| Franklin | 4 | 105 | 856 | 29 | 994 | Romney |
| Fremont | 12 | 76 | 726 | 38 | 852 | Romney |
| Gem | 0 | 150 | 379 | 143 | 672 | Romney |
| Gooding | 47 | 84 | 299 | 86 | 516 | Romney |
| Idaho | 0 | 284 | 0 | 191 | 475 | Paul |
| Jefferson | 11 | 212 | 1642 | 114 | 1979 | Romney |
| Jerome | 28 | 74 | 331 | 101 | 534 | Romney |
| Kootenai | 0 | 496 | 0 | 674 | 1170 | Santorum |
| Latah | 78 | 509 | 197 | 188 | 972 | Paul |
| Lemhi | 44 | 60 | 217 | 64 | 385 | Romney |
| Lewis | 0 | 0 | 25 | 44 | 69 | Santorum |
| Lincoln | 14 | 11 | 147 | 49 | 221 | Romney |
| Madison | 7 | 260 | 2510 | 50 | 2827 | Romney |
| Minidoka | 22 | 80 | 653 | 92 | 847 | Romney |
| Nez Perce | 0 | 127 | 124 | 0 | 251 | Paul |
| Oneida | 3 | 39 | 241 | 18 | 301 | Romney |
| Owyhee | 0 | 0 | 177 | 263 | 440 | Santorum |
| Payette | 0 | 0 | 428 | 302 | 730 | Romney |
| Power | 9 | 13 | 287 | 38 | 347 | Romney |
| Shoshone | 0 | 0 | 63 | 74 | 137 | Santorum |
| Teton | 13 | 44 | 295 | 26 | 378 | Romney |
| Twin Falls | 83 | 332 | 1228 | 409 | 2052 | Romney |
| Valley | 0 | 123 | 152 | 0 | 275 | Romney |
| Washington | 0 | 0 | 222 | 269 | 491 | Santorum |
Notes
- That these totals reflect the final caucus ballots in each county; where only two candidates have votes totaled, this was likely from other candidates being eliminated in previous rounds of voting. Where all candidates have at least one vote, only one ballot was necessary, since the winning candidate had a majority of votes in that county.
- Vote totals for Buddy Roemer, who had formally withdrawn from the Republican race before the caucus, are not provided.
External links
|
|---|
| Election timelines | |
|---|
| National polling | |
|---|
| State polling | |
|---|
| Fundraising | |
|---|
| Debates and forums | |
|---|
| Straw polls | |
|---|
| Major events | |
|---|
Caucuses
and primaries | |
|---|
| Results breakdown | |
|---|
National
conventions | |
|---|
| Reforms | |
|---|