United States presidential election in North Carolina, 2012
|
|
|
|
|
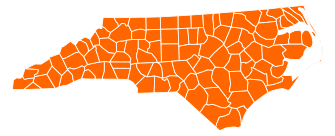
 County Results
|
Romney
40-50%
50-60%
60-70%
70-80%
|
Obama
50-60%
60-70%
70-80%
|
|
|
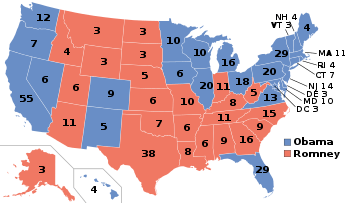
The 2012 United States presidential election in North Carolina took place on November 6, 2012, as part of the 2012 General Election in which all 50 states plus The District of Columbia participated. North Carolina voters chose 15 electors to represent them in the Electoral College via a popular vote pitting incumbent Democratic President Barack Obama and his running mate, Vice President Joe Biden, against Republican challenger and former Massachusetts Governor Mitt Romney and his running mate, Congressman Paul Ryan.
On election day, Mitt Romney narrowly carried the state of North Carolina, winning 50.39% of the vote to Barack Obama's 48.35%, a margin of 2.04%. North Carolina was one of just two states (along with Indiana) which flipped from voting for Obama in 2008 to voting Republican in 2012. Like Indiana, North Carolina had been a reliably Republican state prior to Obama's 2008 win, having not previously gone Democratic since 1976. Unlike Indiana, however, North Carolina was still considered a competitive swing state in 2012, and both campaigns targeted it heavily, with the Democrats even holding their convention in Charlotte, North Carolina.
Primary elections
Democratic presidential primary in North Carolina, 2012
|
|
|
|
| |
 |
|
| Candidate |
Barack Obama |
No Preference |
| Home state |
Illinois |
n/a |
| Delegate count |
104 |
0 |
| Popular vote |
766,077 |
200,810 |
| Percentage |
79.23% |
20.77% |
|
|
|
 North Carolina results by county
Barack Obama |
Democratic primary
The 2012 North Carolina Democratic primary was held May 8, 2012. North Carolina awarded 157 delegates proportionally.[1]
No candidate ran against incumbent President Barack Obama in North Carolina's Democratic presidential preference primary. Obama received 766,079 votes, or 79.23% of the vote, with the remainder (200,810 votes, or 20.77%) going to elect delegates with "No Preference".[1]
At the North Carolina Democratic state convention, 152 delegates were awarded to Obama, with 5 delegates remaining unannounced.[1]
| Democratic Primary Election in NC[2] |
| Candidate |
Votes |
Percentage |
Awarded delegates |
| Barack Obama |
766,077 |
79.23% |
104 |
| No Preference |
200,810 |
20.77% |
0 |
| Totals |
966,889 |
100.00% |
104 |
|
Republican primary
Republican presidential primary in North Carolina, 2012
|
|
|
|
|
 North Carolina results by county
Mitt Romney
(Note: Italicization indicates a withdrawn candidacy) |
The 2012 North Carolina Republican primary was held May 8, 2012.[3][4] North Carolina awarded 55 delegates proportionally.[5] Ron Paul and Mitt Romney were the only active contenders on the ballot. By the time of the primary, Romney had already been declared the party's presumptive nominee.[6]
Romney won the North Carolina GOP presidential primary with 65.62% of the vote. Paul (with 11.12% of the vote) narrowly edged out Santorum (with 10.39% of the vote), and Gingrich came in last with 7.64% of the vote. 5.23% of voters registered "no preference". The awarded delegate count from North Carolina's Republican state convention was Romney with 48 delegates and Paul with 7 delegates.[5]
| Republican Primary Election in NC[5] |
| Candidate |
Votes |
Percentage |
Awarded delegates |
| Mitt Romney |
638,601 |
65.62% |
48 |
| Ron Paul |
108,217 |
11.12% |
7 |
| Rick Santorum (withdrawn) |
101,093 |
10.39% |
|
| Newt Gingrich (withdrawn) |
74,367 |
7.64% |
|
| No Preference |
50,928 |
5.23% |
|
| Totals |
973,206 |
100.00% |
55 |
|
General Election
Overview

North Carolina 2012 Presidential Election by Voting District
By county
| County |
Obama% |
Obama# |
Romney% |
Romney# |
Others% |
Others# |
Total |
| Alamance County | 42.60% | 28,875 | 56.32% | 38,170 | 01.08% | 731 | 67,776 |
| Alexander County | 26.81% | 4,611 | 71.25% | 12,253 | 01.93% | 332 | 17,196 |
| Alleghany County | 31.24% | 1,583 | 66.90% | 3,390 | 01.86% | 94 | 5,067 |
| Anson County | 62.36% | 7,019 | 37.01% | 4,166 | 00.63% | 71 | 11,256 |
| Ashe County | 32.64% | 4,116 | 65.36% | 8,242 | 02.00% | 252 | 12,610 |
| Avery County | 24.26% | 1,882 | 74.31% | 5,766 | 01.43% | 111 | 7,759 |
| Beaufort County | 39.94% | 9,435 | 59.17% | 13,977 | 00.88% | 208 | 23,620 |
| Bertie County | 66.14% | 6,695 | 33.46% | 3,387 | 00.41% | 41 | 10,123 |
| Bladen County | 50.52% | 8,062 | 48.56% | 7,748 | 00.92% | 147 | 15,957 |
| Brunswick County | 38.42% | 22,038 | 60.57% | 34,743 | 01.01% | 581 | 57,362 |
| Buncombe County | 55.31% | 70,625 | 42.84% | 54,701 | 01.86% | 2,370 | 127,696 |
| Burke County | 37.49% | 13,701 | 60.93% | 22,267 | 01.58% | 576 | 36,544 |
| Cabarrus County | 39.31% | 32,849 | 59.30% | 49,557 | 01.39% | 1,160 | 83,566 |
| Caldwell County | 31.38% | 10,898 | 66.88% | 23,229 | 01.74% | 605 | 34,732 |
| Camden County | 32.06% | 1,508 | 66.09% | 3,109 | 01.85% | 87 | 4,704 |
| Carteret County | 29.00% | 10,301 | 69.76% | 24,775 | 01.24% | 441 | 35,517 |
| Caswell County | 48.45% | 5,348 | 50.67% | 5,594 | 00.88% | 97 | 11,039 |
| Catawba County | 34.58% | 24,069 | 63.99% | 44,538 | 01.43% | 994 | 69,601 |
| Chatham County | 51.82% | 18,361 | 47.03% | 16,665 | 01.15% | 408 | 35,434 |
| Cherokee County | 26.25% | 3,378 | 72.11% | 9,278 | 01.64% | 211 | 12,867 |
| Chowan County | 47.38% | 3,556 | 51.85% | 3,891 | 00.77% | 58 | 7,505 |
| Clay County | 27.99% | 1,579 | 70.42% | 3,973 | 01.60% | 90 | 5,642 |
| Cleveland County | 39.37% | 17,062 | 59.51% | 25,793 | 01.12% | 485 | 43,340 |
| Columbus County | 45.58% | 11,050 | 53.38% | 12,941 | 01.04% | 252 | 24,243 |
| Craven County | 40.64% | 18,763 | 58.32% | 26,928 | 01.04% | 479 | 46,170 |
| Cumberland County | 59.38% | 75,792 | 39.69% | 50,666 | 00.93% | 1,183 | 127,641 |
| Currituck County | 31.51% | 3,562 | 66.31% | 7,496 | 02.18% | 246 | 11,304 |
| Dare County | 41.13% | 7,393 | 57.02% | 10,248 | 01.85% | 333 | 17,974 |
| Davidson County | 29.07% | 20,624 | 69.62% | 49,383 | 01.31% | 928 | 70,935 |
| Davie County | 27.75% | 5,735 | 71.05% | 14,687 | 01.20% | 248 | 20,670 |
| Duplin County | 43.87% | 9,033 | 55.44% | 11,416 | 00.69% | 143 | 20,592 |
| Durham County | 75.80% | 111,224 | 23.01% | 33,769 | 01.19% | 1,742 | 146,735 |
| Edgecombe County | 67.89% | 18,310 | 31.68% | 8,546 | 00.43% | 116 | 26,972 |
| Forsyth County | 53.04% | 92,323 | 45.83% | 79,768 | 01.14% | 1,978 | 174,069 |
| Franklin County | 47.33% | 13,436 | 51.44% | 14,603 | 01.23% | 350 | 28,389 |
| Gaston County | 36.66% | 33,171 | 62.04% | 56,138 | 01.30% | 1,174 | 90,483 |
| Gates County | 51.63% | 2,786 | 47.52% | 2,564 | 00.85% | 46 | 5,396 |
| Graham County | 28.35% | 1,119 | 69.67% | 2,750 | 01.98% | 78 | 3,947 |
| Granville County | 51.75% | 13,598 | 47.21% | 12,405 | 01.04% | 272 | 26,275 |
| Greene County | 45.87% | 3,778 | 53.56% | 4,411 | 00.57% | 47 | 8,236 |
| Guilford County | 57.66% | 146,365 | 41.28% | 104,789 | 01.06% | 2,698 | 253,852 |
| Halifax County | 65.86% | 17,176 | 33.60% | 8,763 | 00.54% | 140 | 26,079 |
| Harnett County | 39.92% | 17,331 | 58.89% | 25,565 | 01.20% | 519 | 43,415 |
| Haywood County | 42.30% | 11,833 | 55.88% | 15,633 | 01.82% | 508 | 27,974 |
| Henderson County | 35.58% | 18,642 | 62.98% | 32,994 | 01.44% | 756 | 52,392 |
| Hertford County | 71.84% | 7,843 | 27.54% | 3,007 | 00.62% | 68 | 10,918 |
| Hoke County | 58.96% | 10,076 | 39.90% | 6,819 | 01.14% | 194 | 17,089 |
| Hyde County | 48.80% | 1,163 | 50.06% | 1,193 | 01.13% | 27 | 2,383 |
| Iredell County | 34.15% | 26,076 | 64.56% | 49,299 | 01.30% | 990 | 76,365 |
| Jackson County | 48.47% | 8,095 | 49.42% | 8,254 | 02.11% | 352 | 16,701 |
| Johnston County | 35.58% | 27,290 | 63.15% | 48,427 | 01.27% | 974 | 76,691 |
| Jones County | 44.97% | 2,352 | 54.24% | 2,837 | 00.78% | 41 | 5,230 |
| Lee County | 44.56% | 10,801 | 54.28% | 13,158 | 01.16% | 280 | 24,239 |
| Lenoir County | 49.66% | 13,948 | 49.78% | 13,980 | 00.56% | 158 | 28,086 |
| Lincoln County | 29.98% | 11,024 | 68.71% | 25,267 | 01.32% | 484 | 36,775 |
| Macon County | 33.88% | 5,712 | 64.26% | 10,835 | 01.86% | 314 | 16,861 |
| Madison County | 44.34% | 4,484 | 53.44% | 5,404 | 02.22% | 225 | 10,113 |
| Martin County | 52.03% | 6,583 | 47.38% | 5,995 | 00.58% | 74 | 12,652 |
| McDowell County | 33.32% | 6,031 | 65.06% | 11,775 | 01.62% | 293 | 18,099 |
| Mecklenburg County | 60.65% | 272,262 | 38.24% | 171,668 | 01.11% | 4,970 | 448,900 |
| Mitchell County | 23.67% | 1,838 | 74.77% | 5,806 | 01.56% | 121 | 7,765 |
| Montgomery County | 41.90% | 4,706 | 57.02% | 6,404 | 01.08% | 121 | 11,231 |
| Moore County | 35.56% | 16,505 | 63.55% | 29,495 | 00.89% | 415 | 46,415 |
| Nash County | 50.14% | 24,313 | 49.17% | 23,842 | 00.69% | 337 | 48,492 |
| New Hanover County | 46.96% | 48,668 | 51.52% | 53,385 | 01.52% | 1,575 | 103,628 |
| Northampton County | 67.24% | 7,232 | 32.38% | 3,483 | 00.38% | 41 | 10,756 |
| Onslow County | 35.95% | 18,490 | 62.69% | 32,243 | 01.36% | 702 | 51,435 |
| Orange County | 70.22% | 53,901 | 28.06% | 21,539 | 01.72% | 1,317 | 76,757 |
| Pamlico County | 39.15% | 2,647 | 59.91% | 4,051 | 00.95% | 64 | 6,762 |
| Pasquotank County | 56.78% | 10,282 | 42.15% | 7,633 | 01.06% | 192 | 18,107 |
| Pender County | 39.27% | 9,632 | 59.60% | 14,617 | 01.13% | 278 | 24,527 |
| Perquimans County | 41.48% | 2,759 | 57.46% | 3,822 | 01.07% | 71 | 6,652 |
| Person County | 44.06% | 8,418 | 54.94% | 10,496 | 01.00% | 192 | 19,106 |
| Pitt County | 53.06% | 41,843 | 45.92% | 36,214 | 01.01% | 799 | 78,856 |
| Polk County | 38.63% | 4,013 | 60.03% | 6,236 | 01.35% | 140 | 10,389 |
| Randolph County | 24.33% | 14,773 | 74.38% | 45,160 | 01.29% | 782 | 60,715 |
| Richmond County | 51.01% | 9,904 | 48.06% | 9,332 | 00.93% | 181 | 19,417 |
| Robeson County | 58.18% | 24,988 | 40.77% | 17,510 | 01.04% | 448 | 42,946 |
| Rockingham County | 38.91% | 16,351 | 60.04% | 25,227 | 01.05% | 442 | 42,020 |
| Rowan County | 36.35% | 22,650 | 62.23% | 38,775 | 01.42% | 887 | 62,312 |
| Rutherford County | 32.66% | 9,374 | 66.04% | 18,954 | 01.30% | 374 | 28,702 |
| Sampson County | 44.19% | 11,566 | 55.10% | 14,422 | 00.71% | 186 | 26,174 |
| Scotland County | 58.03% | 8,215 | 41.19% | 5,831 | 00.78% | 110 | 14,156 |
| Stanly County | 29.36% | 8,431 | 69.31% | 19,904 | 01.33% | 382 | 28,717 |
| Stokes County | 27.84% | 6,018 | 70.48% | 15,237 | 01.68% | 364 | 21,619 |
| Surry County | 30.92% | 9,112 | 67.60% | 19,923 | 01.48% | 435 | 29,470 |
| Swain County | 45.71% | 2,618 | 51.96% | 2,976 | 02.34% | 134 | 5,728 |
| Transylvania County | 40.72% | 6,826 | 57.47% | 9,634 | 01.81% | 303 | 16,763 |
| Tyrrell County | 46.94% | 837 | 52.16% | 930 | 00.90% | 16 | 1,783 |
| Union County | 34.28% | 32,473 | 64.51% | 61,107 | 01.21% | 1,148 | 94,728 |
| Vance County | 63.89% | 13,323 | 35.62% | 7,429 | 00.49% | 102 | 20,854 |
| Wake County | 54.94% | 267,262 | 43.50% | 211,596 | 01.56% | 7,569 | 486,427 |
| Warren County | 68.67% | 6,978 | 30.90% | 3,140 | 00.43% | 44 | 10,162 |
| Washington County | 58.98% | 3,833 | 40.34% | 2,622 | 00.68% | 44 | 6,499 |
| Watauga County | 46.98% | 13,002 | 50.09% | 13,861 | 02.93% | 811 | 27,674 |
| Wayne County | 45.40% | 23,314 | 53.83% | 27,641 | 00.77% | 397 | 51,352 |
| Wilkes County | 27.96% | 8,148 | 70.39% | 20,515 | 01.65% | 482 | 29,145 |
| Wilson County | 53.38% | 20,875 | 45.91% | 17,954 | 00.72% | 280 | 39,109 |
| Yadkin County | 23.54% | 3,957 | 74.81% | 12,578 | 01.65% | 278 | 16,813 |
| Yancey County | 42.12% | 3,981 | 55.85% | 5,278 | 02.03% | 192 | 9,451 |
External links
|
|---|
| Election timelines | |
|---|
| National polling | |
|---|
| State polling | |
|---|
| Fundraising | |
|---|
| Debates and forums | |
|---|
| Straw polls | |
|---|
| Major events | |
|---|
Caucuses
and primaries | |
|---|
| Results breakdown | |
|---|
National
conventions | |
|---|
| Reforms | |
|---|