United States presidential election in Pennsylvania, 2012
|
| ||||||||||||||||||||||||||
| ||||||||||||||||||||||||||
| ||||||||||||||||||||||||||
 County Results
| ||||||||||||||||||||||||||
| ||||||||||||||||||||||||||

Part of a series on the 2012 U.S. presidential election |
|---|
| Democratic Party |
| Republican Party |
| Related races |
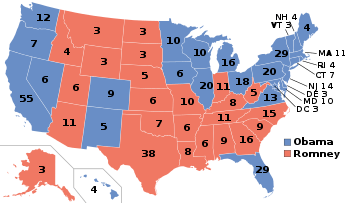
The 2012 United States presidential election in Pennsylvania took place on November 6, 2012, as part of the 2012 general election in which all 50 states plus the District of Columbia participated. Pennsylvania voters chose 20 electors to represent them in the Electoral College via a popular vote. This is a reduction from its 2008 delegation, which had 21 electors; the change was due to reapportionment following the 2010 United States Census.[1] Pennsylvania's 20 electoral votes are allotted on a winner-take-all basis.[2]
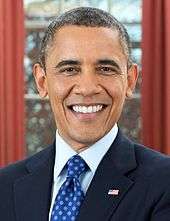
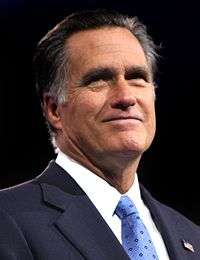
Democratic incumbent President Barack Obama received 52.0% of the vote, versus 46.6% for Republican challenger Mitt Romney.[3] Also on the ballot were Jill Stein (of the Green Party) and Gary Johnson (of the Libertarian Party), who received 0.4% and 0.9%, respectively.[3] Other candidates could run as write-in candidates. The state had been considered likely, but not certain, to go to Obama.[4]
The primary election to select the Democratic and Republican candidates had been held previously, on April 24, 2012.[5] This was the sixth presidential election in a row where the Democratic candidate won Pennsylvania's electoral votes; the state would vote Republican in the following presidential election.
Democratic primary
Incumbent Barack Obama ran unopposed on the Democratic primary ballot.[5] He received 616,102 votes.[5] There were 19,082 write-in votes.[6][7] In the floor vote taken at the Democratic National Convention, 242 Pennsylvania delegates voted for Obama.[7] The other 8 of the state's 250 allocated votes were not announced.[7]
Republican primary
Four candidates were on the Republican primary ballot: Mitt Romney, Rick Santorum, Ron Paul, and Newt Gingrich.[5] The primary was to be the make-or-break moment for Santorum.[8] Santorum had just lost three primaries to Romney, and Romney appeared poised to become the presumptive nominee by achieving a prohibitive lead.[8]
As momentum in the Republican race built for Romney, Santorum suspended his campaign for four days to meet with 'movement conservatives' to strategize.[9] Former Family Research Council chief Gary Bauer, who was present at the sit-down with Santorum, called it a 'strategy meeting to discuss how Senator Santorum prevails.'[10] But rather than returning to campaigning the next Monday, Rick and Karen Santorum canceled campaign events scheduled right after Easter weekend to be in the hospital with their youngest daughter.[11]
In deference to the sick child, Romney ceased airing attack ads, replacing them with positive introductory ones.
On April 10, Santorum formally suspended his campaign. On May 7, he endorsed Romney.[12] Santorum and Gingrich both released their delegates to Romney in August, shortly before the Republican National Convention.[13]
| Candidate | Votes[5] | Percentage | Projected delegates[14] | Actual delegate vote[15] |
|---|---|---|---|---|
| Mitt Romney | 468,374 | 57.8% | 31 | 67 |
| Rick Santorum | 149,056 | 18.4% | 4 | 0 |
| Ron Paul | 106,148 | 13.1% | 5 | 5 |
| Newt Gingrich | 84,537 | 10.4% | 3 | 0 |
| Write-in votes[6] | 2,819 | 0.3% | ||
| Unprojected delegates | 29 | |||
| Total: | 810,934 | 100% | 72 | 72 |
General election
In statewide opinion polling, incumbent Barack Obama consistently led challenger Mitt Romney by a margin of between 2 and 12 percentage points.[16] Analysts rated Pennsylvania as a "likely Democratic" or "Democratic-leaning" state in the presidential race.[4] On the morning of the election, polling aggregator FiveThirtyEight estimated that there was a 99% likelihood that Obama would win Pennsylvania's electoral votes.[17] At the time, Pennsylvania's electoral votes had gone to the Democratic candidate in every presidential election since 1992.[2]
During the summer, there was significant spending on political advertisements in Pennsylvania, by both the Obama campaign and pro-Romney groups such as Crossroads GPS and Americans for Prosperity.[18] However, because Obama maintained a consistent lead in polling, Pennsylvania came to be considered a "safe state" for Obama, and campaign advertising subsided substantially in August.[18] This changed in October, when pro-Romney groups Restore Our Future and Americans for Job Security spent $3 million on advertising in Pennsylvania.[18] Later that month, the Obama campaign and the Romney campaign both launched their own advertising campaigns in Pennsylvania.[18] On November 1, the Republican National Committee announced that it would spend $3 million on television ads in Pennsylvania in the final days of the campaign.[19] In total, pro-Romney spending in Pennsylvania is estimated to amount to as much as $12 million, much more than Obama campaign spending.[19] The Obama campaign characterized the pro-Romney spending surge as "an act of sheer desperation", while the Romney campaign argued that they had a realistic chance of winning the state.[19]
| Party | Candidate | Votes | % | |
|---|---|---|---|---|
| Democratic | Barack Obama | 2,990,274 | 51.97 | |
| Republican | Mitt Romney | 2,680,434 | 46.59 | |
| Libertarian | Gary Johnson | 49,991 | 0.87 | |
| Green | Jill Stein | 21,341 | 0.37 | |
| Other | Other | 11,506 | 0.20% | |
| Total votes | 5,753,546 | 100.0 | ||
By county
| County | Obama% | Obama# | Romney% | Romney# | Others% | Others# | Total |
|---|---|---|---|---|---|---|---|
| Adams County | 35.54% | 15,091 | 63.04% | 26,767 | 1.41% | 599 | 42,457 |
| Allegheny County | 56.69% | 352,687 | 42.12% | 262,039 | 1.18% | 7,355 | 622,081 |
| Armstrong County | 30.56% | 9,045 | 68.04% | 20,142 | 1.40% | 415 | 29,602 |
| Beaver County | 46.05% | 37,055 | 52.62% | 42,344 | 1.34% | 1,075 | 80,474 |
| Bedford County | 22.07% | 4,788 | 76.98% | 16,702 | .95% | 207 | 21,697 |
| Berks County | 48.74% | 83,011 | 49.73% | 84,702 | 1.53% | 2,607 | 170,320 |
| Blair County | 32.40% | 16,276 | 66.32% | 33,319 | 1.29% | 646 | 50,241 |
| Bradford County | 36.81% | 8,624 | 61.51% | 14,410 | 1.67% | 392 | 23,426 |
| Bucks County | 50.00% | 160,521 | 48.78% | 156,579 | 1.22% | 3,916 | 321,016 |
| Butler County | 31.92% | 28,550 | 66.81% | 59,761 | 1.27% | 1,134 | 89,445 |
| Cambria County | 40.06% | 24,249 | 58.10% | 35,163 | 1.84% | 1,114 | 60,526 |
| Cameron County | 34.30% | 724 | 64.38% | 1,359 | 1.33% | 28 | 2,111 |
| Carbon County | 45.27% | 11,580 | 52.79% | 13,504 | 1.94% | 497 | 25,581 |
| Centre County | 49.57% | 33,677 | 49.60% | 33,697 | 2.08% | 1,449 | 69,192 |
| Chester County | 49.34% | 124,311 | 49.54% | 124,840 | 1.12% | 2,822 | 251,973 |
| Clarion County | 31.24% | 5,056 | 66.90% | 10,828 | 1.87% | 302 | 16,186 |
| Clearfield County | 34.79% | 11,121 | 63.65% | 20,347 | 1.56% | 499 | 31,967 |
| Clinton County | 43.23% | 5,734 | 55.05% | 7,303 | 1.72% | 228 | 13,265 |
| Columbia County | 42.68% | 10,937 | 55.56% | 14,236 | 1.76% | 450 | 25,623 |
| Crawford County | 39.23% | 13,883 | 59.06% | 20,901 | 1.71% | 604 | 35,388 |
| Cumberland County | 40.04% | 44,367 | 58.48% | 64,809 | 1.48% | 1,638 | 110,814 |
| Dauphin County | 52.39% | 64,965 | 46.33% | 57,450 | 1.28% | 1,593 | 124,008 |
| Delaware County | 60.16% | 171,792 | 38.82% | 110,853 | 1.02% | 2,919 | 285,564 |
| Elk County | 41.27% | 5,463 | 57.25% | 7,579 | 1.48% | 196 | 13,238 |
| Erie County | 57.36% | 68,036 | 41.33% | 49,025 | 1.31% | 1,558 | 118,619 |
| Fayette County | 45.30% | 21,971 | 53.64% | 26,018 | 1.06% | 516 | 48,505 |
| Forest County | 38.75% | 896 | 59.82% | 1,383 | 1.43% | 33 | 2,312 |
| Franklin County | 30.11% | 18,995 | 68.58% | 43,260 | 1.30% | 823 | 63,078 |
| Fulton County | 21.15% | 1,310 | 77.71% | 4,814 | 1.15% | 71 | 6,195 |
| Greene County | 40.46% | 5,852 | 58.27% | 8,428 | 1.27% | 184 | 14,464 |
| Huntingdon County | 30.67% | 5,409 | 67.91% | 11,979 | 1.42% | 251 | 17,639 |
| Indiana County | 39.85% | 14,473 | 58.53% | 21,257 | 1.63% | 591 | 36,321 |
| Jefferson County | 26.45% | 4,787 | 72.10% | 13,048 | 1.45% | 262 | 18,097 |
| Juniata County | 26.71% | 2,547 | 71.97% | 6,862 | 1.32% | 126 | 9,535 |
| Lackawanna County | 63.09% | 61,838 | 35.80% | 35,085 | 1.11% | 1,092 | 98,015 |
| Lancaster County | 39.78% | 88,481 | 58.74% | 130,669 | 1.48% | 3,286 | 222,436 |
| Lawrence County | 44.86% | 17,513 | 53.92% | 21,047 | 1.22% | 476 | 39,036 |
| Lebanon County | 35.17% | 19,900 | 63.40% | 35,872 | 1.43% | 808 | 56,580 |
| Lehigh County | 53.25% | 78,283 | 45.49% | 66,874 | 1.26% | 1,845 | 147,002 |
| Luzerne County | 51.68% | 64,307 | 46.87% | 58,325 | 1.45% | 1,807 | 124,439 |
| Lycoming County | 32.70% | 15,203 | 65.94% | 30,658 | 1.36% | 632 | 46,493 |
| McKean County | 35.06% | 5,297 | 63.18% | 9,545 | 1.76% | 266 | 15,108 |
| Mercer County | 47.64% | 24,232 | 50.97% | 25,925 | 1.39% | 706 | 50,863 |
| Mifflin County | 26.10% | 4,273 | 72.93% | 11,939 | .97% | 159 | 16,371 |
| Monroe County | 55.98% | 35,221 | 42.70% | 26,867 | 1.32% | 829 | 62,917 |
| Montgomery County | 56.61% | 233,356 | 42.30% | 174,381 | 1.08% | 4,463 | 412,200 |
| Montour County | 38.99% | 3,053 | 59.40% | 4,652 | 1.61% | 126 | 7,831 |
| Northampton County | 51.71% | 67,606 | 47.00% | 61,446 | 1.29% | 1,683 | 130,735 |
| Northumberland County | 39.36% | 13,072 | 58.77% | 19,518 | 1.87% | 622 | 33,212 |
| Perry County | 29.72% | 5,685 | 68.59% | 13,120 | 1.69% | 323 | 19,128 |
| Philadelphia County | 85.29% | 588,806 | 13.97% | 96,467 | .73% | 5,054 | 690,327 |
| Pike County | 43.86% | 10,210 | 54.93% | 12,786 | 1.22% | 283 | 23,279 |
| Potter County | 26.19% | 1,897 | 72.23% | 5,231 | 1.57% | 114 | 7,242 |
| Schuylkill County | 42.52% | 24,546 | 55.91% | 32,278 | 1.56% | 903 | 57,727 |
| Snyder County | 31.24% | 4,687 | 67.14% | 10,073 | 1.61% | 242 | 15,002 |
| Somerset County | 27.80% | 9,436 | 70.66% | 23,984 | 1.54% | 522 | 33,942 |
| Sullivan County | 35.06% | 1,034 | 63.34% | 1,868 | 1.59% | 47 | 2,949 |
| Susquehanna County | 38.43% | 6,935 | 59.85% | 10,800 | 1.71% | 309 | 18,044 |
| Tioga County | 31.50% | 5,357 | 66.70% | 11,342 | 1.79% | 305 | 17,004 |
| Union County | 37.55% | 6,109 | 60.83% | 9,896 | 1.62% | 263 | 16,268 |
| Venango County | 35.84% | 7,945 | 62.32% | 13,815 | 1.84% | 407 | 22,167 |
| Warren County | 40.44% | 6,995 | 57.86% | 10,010 | 1.70% | 294 | 17,299 |
| Washington County | 42.58% | 40,345 | 56.18% | 53,230 | 1.24% | 1,175 | 94,750 |
| Wayne County | 38.86% | 8,396 | 59.68% | 12,896 | 1.46% | 315 | 21,607 |
| Westmoreland County | 37.58% | 63,722 | 61.29% | 103,932 | 1.13% | 1,918 | 169,572 |
| Wyoming County | 42.63% | 5,061 | 55.48% | 6,587 | 1.89% | 224 | 11,872 |
| York County | 38.68% | 73,191 | 59.88% | 113,304 | 1.44% | 2,734 | 189,229 |
Electoral College Delegation
In accordance with Commonwealth law and Chapter 1, Section 7 of Title 3, United States Code (62 Stat. 672 as amended,) the 20 Pennsylvania electors pledged for Obama and Biden cast their votes on 17 December in the State House of Representatives chamber. The Pennsylvania Democratic Committee seated the following electors for this procedure:[20]
- Mark L. Alderman
- Cindy M. Bass
- Richard Bloomingdale
- C. Kim Bracey
- James R. Burn Jr
- Jay Costa
- Frank Dermody
- Rich Fitzgerald
- Penny Gerber
- Amanda Green Hawkins
- Vincent Hughes
- Susan Golden Jacobson
- Clifford B. Levine
- Robert M. McCord
- Michael Nutter
- Lazar M. Palnick
- Roxanne G. Pauline
- José Rosado
- Cynthia D. Shapira
- Josh Shapiro
See also
References
- ↑ O'Neill, Brian (October 16, 2011). "Don't let Pa. flunk out of the Electoral College". Pittsburgh Post-Gazette. p. A-2.
- 1 2 McNulty, Timothy (September 8, 2012). "Romney campaign not expected to invest much in Pa". Pittsburgh Post-Gazette. p. A-1.
- 1 2 3 "2012 General Primary". Pennsylvania Department of State. 2012. Archived from the original on January 19, 2013. Retrieved November 15, 2012.
- 1 2 Electoral-vote.com labeled Pennsylvania "likely Democratic". Tanenbaum, Andrew S. "Electoral-vote.com". Retrieved October 17, 2012.
The Washington Post labeled Pennsylvania "lean Democratic". "2012 Election Map: The race for the presidency". The Washington Post. Retrieved October 17, 2012.
CNN labeled Pennsylvania "leaning Obama". Dengo, Sophia; Perry, Bryan; Hayes, John; John, Joel; Slaton, A.D. "CNN Electoral Map". CNN Politics. CNN. Retrieved October 17, 2012.
The Cook Political Report labeled Pennsylvania "lean Democratic". "Presidential: Maps". The Cook Political Report. Retrieved October 17, 2012. - 1 2 3 4 5 "2012 General Primary". Pennsylvania Department of State. 2012. Archived from the original on April 28, 2012. Retrieved October 18, 2012.
- 1 2 "2012 General Primary Write-in Totals" (PDF). Pennsylvania Department of State. 2012. Archived (PDF) from the original on October 18, 2012. Retrieved October 18, 2012.
- 1 2 3 "2012 Presidential Primaries, Caucuses, and Conventions: Pennsylvania Democrat". The Green Papers. 2012. Retrieved October 18, 2012.
- 1 2 Fitzgerald, Thomas; Worden, Amy (April 6, 2012). "Santorum meets with conservatives as Romney, in Pa., looks to the fall". The Philadelphia Inquirer. p. A1.
- ↑ "Santorum Taking Four-Day Break from Campaign Trail". Fox Television Stations, Inc. 4 April 2012.
- ↑ "SANTORUM MEETS WITH 'MOVEMENT CONSERVATIVES' TO GO BIG, BEFORE GOING HOME". The Blaze, LLC. 5 April 2012.
- ↑ "Santorum Cancels Monday Events to Be With Ill Child". The Wall Street Journal. 7 April 2012.
- ↑ Walshe, Shushannah (May 7, 2012). "Rick Santorum Formally Endorses Mitt Romney". The Note. ABC News. Retrieved October 24, 2012.
- ↑ Camia, Catalina (August 24, 2012). "Santorum releases GOP convention delegates". USA Today. Retrieved October 24, 2012.
- ↑ "Primaries & Caucuses: Results: Pennsylvania". CNN Politics. CNN. July 30, 2012. Retrieved October 20, 2012.
- ↑ When Pennsylvania delegation chair Tom Corbett announced the Pennsylvania delegates' votes on the convention floor, he said that sixty-seven delegates had voted for Romney and five had voted for Paul Ryan. However, since Ryan was not a candidate (rather, he was Romney's running mate), it is generally assumed that Corbett misspoke—that the five votes were actually for Ron Paul.
- "2012 Presidential Primaries, Caucuses, and Conventions: Republican Convention". The Green Papers. 2012. Retrieved October 20, 2012.
- Brown, Catherine (August 29, 2012). "NJ Puts Romney Over the Top". NBC10 Philadelphia. Retrieved October 20, 2012.
Later, as the roll call continued, the Pennsylvania delegation led by Gov. Tom Corbett (R), cast 67 of its delegate votes for Romney, the rest went to Ron Paul, although Corbett may have actually said 'Paul Ryan,' in a possible slip of the tongue.
- Doherty, Brian (August 29, 2012). "Ron Paul's Followers and the GOP: Where To From Here, and How?". Reason. Retrieved October 20, 2012.
In the end, Paul got around 190 delegates votes (if we presume Pennsylvania's five for 'Paul Ryan' were actually meant for Ron Paul).
- ↑ "Pennsylvania: Romney vs. Obama". RealClearPolitics. Retrieved October 17, 2012.
- ↑ Silver, Nate. "FiveThirtyEight". The New York Times. Retrieved November 8, 2012.
- 1 2 3 4 Levy, Marc (October 30, 2012). "Romney, Obama campaigns resume Pa. ad campaigns". Philly.com. Associated Press. Archived from the original on November 3, 2012. Retrieved November 2, 2012.
- 1 2 3 Levy, Marc (November 1, 2012). "Romney, RNC splashing down in Pa. in 11th-hour bid". Deseret News. Associated Press. Archived from the original on November 3, 2012. Retrieved November 2, 2012.
- ↑ "Electoral College". Pennsylvania Department of State. Retrieved 14 June 2013.
External links
- The Green Papers: for Pennsylvania
- The Green Papers: Major state elections in chronological order
State results of the 2012 U.S. presidential election | ||
|---|---|---|
|  | |
| ||