DeWitt County, Illinois
| DeWitt County, Illinois | |
|---|---|
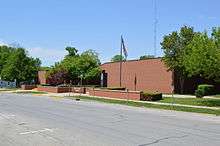 DeWitt County Courthouse in Clinton | |
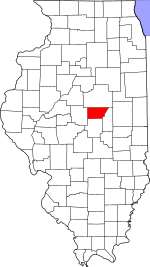 Location in the U.S. state of Illinois | |
 Illinois's location in the U.S. | |
| Founded | 1839 |
| Named for | DeWitt Clinton |
| Seat | Clinton |
| Largest city | Clinton |
| Area | |
| • Total | 405 sq mi (1,049 km2) |
| • Land | 398 sq mi (1,031 km2) |
| • Water | 7.6 sq mi (20 km2), 1.9% |
| Population | |
| • (2010) | 16,561 |
| • Density | 42/sq mi (16/km2) |
| Congressional district | 13th |
| Time zone | Central: UTC−6/−5 |
| Website |
www |
DeWitt County is a county located in the U.S. state of Illinois. As of the 2010 census, the population was 16,561.[1] Its county seat is Clinton.[2] The county was formed on March 1, 1839 from Macon and McLean counties. The county was named in honor of the seventh Governor of New York State, DeWitt Clinton.[3]
DeWitt County is included in Bloomington–Normal, IL Metropolitan Statistical Area.
The U.S. Census Bureau and the USGS list the county's name as De Witt, although the county uses the name DeWitt (no space).
History
 DeWitt County from its creation in 1839 to the splitting off of Piatt County in 1841
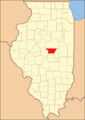 DeWitt County from 1841 to 1845
 DeWitt County in 1845, when it was reduced to its current size
Geography
According to the U.S. Census Bureau, the county has a total area of 405 square miles (1,050 km2), of which 398 square miles (1,030 km2) is land and 7.6 square miles (20 km2) (1.9%) is water.[4]
Climate and weather
| Clinton, Illinois | ||||||||||||||||||||||||||||||||||||||||||||||||||||||||||||
|---|---|---|---|---|---|---|---|---|---|---|---|---|---|---|---|---|---|---|---|---|---|---|---|---|---|---|---|---|---|---|---|---|---|---|---|---|---|---|---|---|---|---|---|---|---|---|---|---|---|---|---|---|---|---|---|---|---|---|---|---|
| Climate chart (explanation) | ||||||||||||||||||||||||||||||||||||||||||||||||||||||||||||
| ||||||||||||||||||||||||||||||||||||||||||||||||||||||||||||
| ||||||||||||||||||||||||||||||||||||||||||||||||||||||||||||
In recent years, average temperatures in the county seat of Clinton have ranged from a low of 17 °F (−8 °C) in January to a high of 88 °F (31 °C) in July, although a record low of −25 °F (−32 °C) was recorded in February 1905 and a record high of 113 °F (45 °C) was recorded in July 1954. Average monthly precipitation ranged from 1.95 inches (50 mm) in February to 4.54 inches (115 mm) in July.[5]
Adjacent counties
- McLean County - north
- Piatt County - east
- Macon County - south
- Logan County - west
Major highways
Demographics
| Historical population | |||
|---|---|---|---|
| Census | Pop. | %± | |
| 1840 | 3,247 | — | |
| 1850 | 5,002 | 54.0% | |
| 1860 | 10,820 | 116.3% | |
| 1870 | 14,768 | 36.5% | |
| 1880 | 17,010 | 15.2% | |
| 1890 | 17,011 | 0.0% | |
| 1900 | 18,972 | 11.5% | |
| 1910 | 18,906 | −0.3% | |
| 1920 | 19,252 | 1.8% | |
| 1930 | 18,598 | −3.4% | |
| 1940 | 18,244 | −1.9% | |
| 1950 | 16,894 | −7.4% | |
| 1960 | 17,253 | 2.1% | |
| 1970 | 16,975 | −1.6% | |
| 1980 | 18,108 | 6.7% | |
| 1990 | 16,516 | −8.8% | |
| 2000 | 16,798 | 1.7% | |
| 2010 | 16,561 | −1.4% | |
| Est. 2016 | 16,226 | [6] | −2.0% |
| U.S. Decennial Census[7] 1790-1960[8] 1900-1990[9] 1990-2000[10] 2010-2013[1] | |||
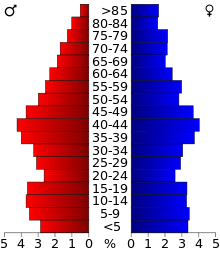
As of the 2010 United States Census, there were 16,561 people, 6,811 households, and 4,618 families residing in the county.[11] The population density was 41.7 inhabitants per square mile (16.1/km2). There were 7,521 housing units at an average density of 18.9 per square mile (7.3/km2).[4] The racial makeup of the county was 96.8% white, 0.5% black or African American, 0.4% Asian, 0.2% American Indian, 0.9% from other races, and 1.2% from two or more races. Those of Hispanic or Latino origin made up 2.1% of the population.[11] In terms of ancestry, 31.2% were American, 21.7% were German, 15.8% were English, and 12.3% were Irish.[12]
Of the 6,811 households, 30.1% had children under the age of 18 living with them, 53.0% were married couples living together, 10.0% had a female householder with no husband present, 32.2% were non-families, and 27.5% of all households were made up of individuals. The average household size was 2.39 and the average family size was 2.88. The median age was 41.7 years.[11]
The median income for a household in the county was $45,347 and the median income for a family was $56,806. Males had a median income of $41,649 versus $27,729 for females. The per capita income for the county was $24,320. About 6.4% of families and 8.6% of the population were below the poverty line, including 12.2% of those under age 18 and 6.6% of those age 65 or over.[13]
Communities
Cities
Villages
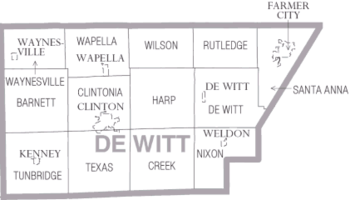
Townships
De Witt County is divided into thirteen townships:
Politics
| Year | Republican | Democratic | Third Parties |
|---|---|---|---|
| 2016 | 67.2% 5,077 | 25.3% 1,910 | 7.5% 569 |
| 2012 | 62.2% 4,579 | 35.3% 2,601 | 2.6% 188 |
| 2008 | 55.5% 4,348 | 42.2% 3,308 | 2.2% 175 |
| 2004 | 63.1% 4,920 | 36.4% 2,836 | 0.5% 42 |
| 2000 | 56.3% 3,968 | 40.7% 2,870 | 3.0% 213 |
| 1996 | 45.2% 2,978 | 43.7% 2,878 | 11.1% 733 |
| 1992 | 40.8% 3,164 | 38.8% 3,009 | 20.4% 1,586 |
| 1988 | 59.3% 3,942 | 40.0% 2,660 | 0.7% 43 |
| 1984 | 65.6% 4,534 | 34.0% 2,352 | 0.4% 29 |
| 1980 | 63.3% 4,648 | 30.8% 2,262 | 5.9% 434 |
| 1976 | 54.0% 4,137 | 45.4% 3,477 | 0.7% 52 |
| 1972 | 65.2% 5,025 | 34.7% 2,672 | 0.1% 8 |
| 1968 | 54.2% 4,247 | 36.0% 2,823 | 9.8% 764 |
| 1964 | 45.2% 3,605 | 54.8% 4,371 | |
| 1960 | 58.4% 5,074 | 41.5% 3,607 | 0.1% 8 |
| 1956 | 63.2% 5,307 | 36.8% 3,093 | 0.1% 4 |
| 1952 | 61.8% 5,212 | 38.2% 3,221 | 0.0% 3 |
| 1948 | 55.6% 4,178 | 43.8% 3,290 | 0.6% 45 |
| 1944 | 55.4% 4,630 | 43.8% 3,658 | 0.8% 69 |
| 1940 | 51.8% 5,477 | 47.8% 5,052 | 0.4% 45 |
| 1936 | 44.2% 4,544 | 55.2% 5,676 | 0.6% 60 |
| 1932 | 43.5% 4,207 | 55.2% 5,339 | 1.3% 127 |
| 1928 | 69.4% 6,100 | 29.9% 2,631 | 0.7% 59 |
| 1924 | 58.8% 5,173 | 31.3% 2,752 | 10.0% 877 |
| 1920 | 60.7% 5,001 | 37.4% 3,079 | 2.0% 162 |
| 1916 | 47.9% 4,380 | 48.8% 4,460 | 3.3% 306 |
| 1912 | 28.5% 1,346 | 39.8% 1,880 | 31.7% 1,499 |
| 1908 | 53.2% 2,628 | 43.6% 2,155 | 3.2% 160 |
| 1904 | 56.0% 2,771 | 37.8% 1,872 | 6.2% 309 |
| 1900 | 52.3% 2,694 | 45.8% 2,361 | 1.9% 99 |
| 1896 | 51.5% 2,587 | 47.1% 2,370 | 1.4% 71 |
| 1892 | 47.4% 2,059 | 47.9% 2,083 | 4.7% 206 |
DeWitt is a powerfully Republican county. It has not been carried by a Democratic presidential candidate since Lyndon Johnson’s 1964 landslide, and even before that it was carried by Democrats only in strong winning elections like 1936, 1932, 1916, 1912 and 1892.
See also
Notes
- 1 2 "State & County QuickFacts". United States Census Bureau. Archived from the original on July 9, 2011. Retrieved July 4, 2014.
- ↑ "Find a County". National Association of Counties. Archived from the original on 2011-05-31. Retrieved 2011-06-07.
- ↑ Gannett, Henry (1905). The Origin of Certain Place Names in the United States. Govt. Print. Off. p. 105.
- 1 2 "Population, Housing Units, Area, and Density: 2010 - County". United States Census Bureau. Retrieved 2015-07-11.
- 1 2 "Monthly Averages for Clinton, Illinois". The Weather Channel. Retrieved 2011-01-27.
- ↑ "Population and Housing Unit Estimates". Retrieved June 9, 2017.
- ↑ "U.S. Decennial Census". United States Census Bureau. Archived from the original on May 12, 2015. Retrieved July 4, 2014.
- ↑ "Historical Census Browser". University of Virginia Library. Retrieved July 4, 2014.
- ↑ "Population of Counties by Decennial Census: 1900 to 1990". United States Census Bureau. Retrieved July 4, 2014.
- ↑ "Census 2000 PHC-T-4. Ranking Tables for Counties: 1990 and 2000" (PDF). United States Census Bureau. Retrieved July 4, 2014.
- 1 2 3 "DP-1 Profile of General Population and Housing Characteristics: 2010 Demographic Profile Data". United States Census Bureau. Retrieved 2015-07-11.
- ↑ "DP02 SELECTED SOCIAL CHARACTERISTICS IN THE UNITED STATES – 2006-2010 American Community Survey 5-Year Estimates". United States Census Bureau. Retrieved 2015-07-11.
- ↑ "DP03 SELECTED ECONOMIC CHARACTERISTICS – 2006-2010 American Community Survey 5-Year Estimates". United States Census Bureau. Retrieved 2015-07-11.
- ↑ http://uselectionatlas.org/RESULTS
References
External links
| Wikimedia Commons has media related to DeWitt County, Illinois. |
Places adjacent to DeWitt County, Illinois | ||||||||||
|---|---|---|---|---|---|---|---|---|---|---|
| ||||||||||
Municipalities and communities of DeWitt County, Illinois, United States | ||
|---|---|---|
| Cities | ||
| Villages | ||
| Townships | ||
| Unincorporated communities | ||
| Footnotes | ‡This populated place also has portions in an adjacent county or counties | |
