United States presidential election in North Carolina, 2008
|
| ||||||||||||||||||||||||||
| ||||||||||||||||||||||||||
| ||||||||||||||||||||||||||
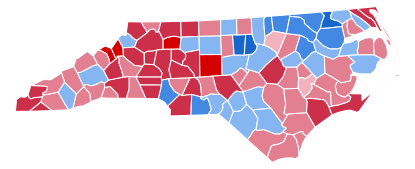 County Results
| ||||||||||||||||||||||||||
| ||||||||||||||||||||||||||
| Elections in North Carolina | ||||||||
|---|---|---|---|---|---|---|---|---|
 | ||||||||
|
||||||||
|
State legislature
|
||||||||
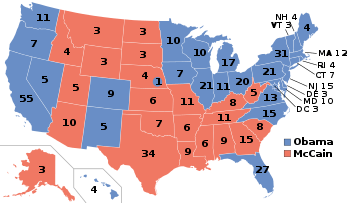
The 2008 United States presidential election in North Carolina was part of the national event on November 4, 2008, throughout all 50 states and D.C.. In North Carolina, voters chose 15 representatives, or electors, to the Electoral College, who voted for president and vice president.
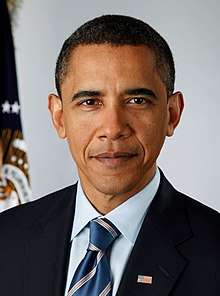
North Carolina was won by Democratic nominee Barack Obama with a 0.32% margin of victory. Prior to the election, most news organizations considered the state as a toss-up, or swing state, but few truly believed Obama would win it.
Throughout the general election, the state was heavily targeted by both campaigns. A high turnout by African-American voters, bolstered by overwhelming support from younger voters were the major factors that helped deliver North Carolina's 15 electoral votes to Obama, making him the first Democratic presidential nominee to carry the state in 32 years. Prior to 2008, the last Democratic candidate to win North Carolina was Jimmy Carter in 1976. Bill Clinton came within 20,000 votes of winning the state in 1992. As of the 2016 presidential election, this is the last time that the Democratic nominee carried North Carolina, as well as Jackson County, Hyde County, and Caswell County.
Primaries
Campaign
Predictions
A total of 17 news organizations made state-by-state predictions of the election. Here are their last predictions before election day:
- D.C. Political Report: Republican[1]
- Cook Political Report: Toss-Up[2]
- Takeaway: Toss-Up[3]
- Election Projection: Leaning McCain[4]
- Electoral-vote.com: Leaning Democrat[5]
- Washington Post: Toss-Up[6]
- Politico: Leaning McCain[7]
- Real Clear Politics: Toss-Up[8]
- FiveThirtyEight.com: Toss-Up[6]
- CQ Politics: Toss-Up[9]
- New York Times: Toss-Up[10]
- CNN: Toss-Up[11]
- NPR: Leaning McCain[6]
- MSNBC: Toss-Up[6]
- Fox News: Toss-Up[12]
- Associated Press: Toss-Up[13]
- Rasmussen Reports: Toss-Up[14]
Polling
Early on, McCain won almost every single pre-election poll. However, on September 23, Rasmussen Reports showed Obama leading in a poll for the first time. He won the poll 49% to 47%. After that, polls showed the state being a complete toss-up, as both McCain and Obama were winning many polls and no candidate was taking a consistent lead in the state. Commentators attributed the drastic turnaround in the state to the influence of voter unhappiness about the financial crisis and the effectiveness of heavy advertising and organizing to get out the vote by the Obama campaign in the fall election. The final three polls found a tie with both candidate at 49%, which was accurate compared to the results.[15]
Fundraising
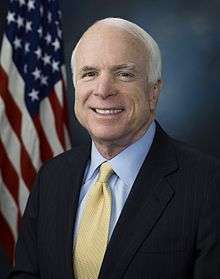
John McCain raised a total of $2,888,922 in the state. Barack Obama raised $8,569,866.[16]
Advertising and visits
Obama and his interest groups spent $15,178,674. McCain and his interest groups spent $7,137,289.[17] The Democratic ticket visited the state 12 times. The Republican ticket visited the state 8 times.[18]
Analysis
The winner was not certain even several days after the election, as thousands of provisional and absentee ballots were still being counted. However, when it became evident that McCain would need to win an improbable majority of these votes to overcome Obama's election night lead, the major news networks finally called the state's 15 electoral votes for Obama. North Carolina was the second-closest state in 2008; only in Missouri was the race closer.
Situated in the South, which has become a Republican stronghold in recent elections, North Carolina is an anomaly. While very Democratic at the local and state level, the last Democratic presidential nominee to win the Tar Heel State was Jimmy Carter in 1976; not even the Southern moderate populist Bill Clinton from Arkansas could win North Carolina.
Obama decided early on to campaign aggressively in the state. It paid off quickly; most polls from spring onward showed the race within single digits of difference between the candidates. He also dramatically outspent McCain in the state and had an extensive grassroots campaign of organizing to get out the vote. This was also one of the closest statewide contests of 2008, as Obama captured North Carolina just by 0.32 percent of the vote - a margin of only 14,177 votes out of 4.2 million statewide. Only in Missouri was the race closer, where McCain nipped Obama by less than 4,000 votes, a margin of 0.14 percent.
Republicans have traditionally done well in the western part of North Carolina that is a part of Appalachia, while Democrats are stronger in the urbanized east. When a Democrat wins in North Carolina, almost everything from Charlotte eastward is usually coated blue. Even when Democrats lose, they often still retain a number of counties in the industrial southeast (alongside Fayetteville), the African-American northeast, the fast-growing I-85 Corridor in the Piedmont, and sometimes the western Appalachian region next to Tennessee. For example, a map of Bill Clinton's narrow 1992 loss in North Carolina shows him narrowly winning all these regions.[19]
Obama did not take the traditional Democratic path to victory. Instead, his main margins came from the cities, where he did particularly well throughout the country. While Obama won only 33 of North Carolina's 100 counties, these counties contained more than half of the state's population.
Obama's victory margin came largely by running up huge majorities in the I-85 Corridor, a developing megalopolis which is home to more than two-thirds of the state's population and casts almost 70 percent of the state's vote. The state's five largest counties--Mecklenburg (home to Charlotte) Wake (home to Raleigh), Guilford (home to Greensboro), Forsyth (home to Winston-Salem) and Durham (home to Durham)--are all located in this area, and Obama swept them all by 11 percentage points or more. In 1992, Bill Clinton had been able to win only Durham County by this margin; he narrowly lost Forsyth and Mecklenburg (the latter was where Obama had his biggest margin in the state). Ultimately, Obama's combined margin of 350,000 votes in these counties was too much for McCain to overcome.
McCain did well in the Charlotte suburbs, Appalachian foothills and mountain country; he carried all but four counties west of Winston-Salem. Aside from the I-85 Corridor, Obama's results were mediocre in the traditional Democratic base. He lost badly in Appalachia, mirroring the difficulties he had throughout this region. Obama won only three counties in this region, one of which was Buncombe County, home to Asheville, the largest city in the region and a destination for retirees from the North. In the Fayetteville area, he did as well as Al Gore (who had lost North Carolina by double-digits).
Obama did not rely on the traditional Democratic base but rather a new coalition of city voters to win North Carolina. If he had not taken the five largest counties, Obama would have lost the state by a considerable margin; instead, he pulled off the narrowest victory by creating a unique coalition of voters. He particularly attracted highly affluent and educated migrants from the Northeast, who traditionally tend to vote Democratic; as well as African Americans, Hispanics (an increasing population in the state), and college students, voting blocs who had overwhelmingly supported him during the course of the 2008 Democratic presidential primary.
During the same election, Democrats picked up a seat in the U.S. House of Representatives in North Carolina's 8th congressional district, where incumbent Republican Robin Hayes was ousted by Democrat Larry Kissell, a high school social studies teacher who almost toppled Hayes in 2006. Kissell received 55.38% of the vote while Hayes took in 44.62%, a 10.76-percent difference. Democrats held onto the Governor's Mansion; term-limited incumbent Democratic Governor Mike Easley was ineligible to seek a third term but Lieutenant Governor Beverly Perdue defeated Republican Pat McCrory, the incumbent mayor of Charlotte. Perdue received 50.23% of the vote while McCrory took 46.90%, with the remaining 2.86% going to Libertarian Michael Munger.
In a highly targeted U.S. Senate race, Democratic State Senator Kay Hagan defeated incumbent Republican Elizabeth Dole by a wider-than-anticipated margin - by 8.47 points. Hagan received 52.65% while Dole took 44.18%. The race received widespread attention after the National Republican Senatorial Committee (NRSC) ran its notorious "Godless" ad that accused Hagan, a Sunday school teacher, of accepting money from atheists and accused her of being an atheist. The adverse reaction resulting from the ad was considered a major factor contributing to Dole's defeat. At the state level, Democrats increased their gains in the North Carolina General Assembly, picking up five seats in the North Carolina House of Representatives and one seat in the North Carolina Senate.
According to exit polls, more than 95% of African American voters cast ballots for Obama. This played a critical role in North Carolina, as 95% of the state's registered African-American voters turned out, with Obama carrying an unprecedented 100% of African-American women, as well as younger African Americans aged 18 to 29, according to exit polling. Comparatively, the overall turnout of voters statewide was 69%.[20]
Results
| United States presidential election in North Carolina, 2008 | ||||||
|---|---|---|---|---|---|---|
| Party | Candidate | Running mate | Votes | Percentage | Electoral votes | |
| Democratic | Barack Obama | Joe Biden | 2,142,651 | 49.70% | 15 | |
| Republican | John McCain | Sarah Palin | 2,128,474 | 49.38% | 0 | |
| Libertarian | Bob Barr | Wayne Allyn Root | 25,722 | 0.60% | 0 | |
| Write-ins | Write-ins | 12,292 | 0.29% | 0 | ||
| Independent | Ralph Nader (Write-in) | Matt Gonzalez | 1,454 | 0.03% | 0 | |
| Green | Cynthia McKinney (Write-in) | Rosa Clemente | 158 | 0.00% | 0 | |
| Others | Others | 38 | 0.00% | 0 | ||
| Totals | 4,310,789 | 100.00% | 15 | |||
| Voter turnout (Voting age population) | 63.0% | |||||
Results breakdown
By county
| County | Obama% | Obama# | McCain% | McCain# | Total |
|---|---|---|---|---|---|
| Alamance | 45.3% | 28,590 | 54.7% | 34,501 | 63,091 |
| Alexander | 30.5% | 5,153 | 69.5% | 11,747 | 16,900 |
| Alleghany | 39.3% | 2,017 | 60.7% | 3,117 | 5,134 |
| Anson | 60.7% | 6,293 | 39.3% | 4,067 | 10,360 |
| Ashe | 38.1% | 4,861 | 61.9% | 7,885 | 12,746 |
| Avery | 27.8% | 2,163 | 72.2% | 5,617 | 7,780 |
| Beaufort | 41.2% | 9,426 | 58.8% | 13,437 | 22,863 |
| Bertie | 65.2% | 6,248 | 34.8% | 3,338 | 9,586 |
| Bladen | 51.0% | 7,846 | 49.0% | 7,530 | 15,376 |
| Brunswick | 41.0% | 21,280 | 59.0% | 30,662 | 51,942 |
| Buncombe | 57.1% | 69,415 | 42.9% | 52,236 | 121,651 |
| Burke | 40.2% | 14,623 | 59.8% | 21,766 | 36,389 |
| Cabarrus | 40.8% | 31,191 | 59.2% | 45,340 | 76,531 |
| Caldwell | 34.9% | 12,007 | 65.1% | 22,397 | 34,404 |
| Camden | 33.7% | 1,587 | 66.3% | 3,118 | 4,705 |
| Carteret | 32.6% | 11,079 | 67.4% | 22,868 | 33,947 |
| Caswell | 51.4% | 5,466 | 48.6% | 5,177 | 10,643 |
| Catawba | 37.3% | 25,535 | 62.7% | 42,843 | 68,378 |
| Chatham | 54.9% | 17,783 | 45.1% | 14,591 | 32,374 |
| Cherokee | 30.4% | 3,748 | 69.6% | 8,591 | 12,339 |
| Chowan | 49.3% | 3,652 | 50.7% | 3,751 | 7,403 |
| Clay | 31.9% | 1,731 | 68.1% | 3,692 | 5,423 |
| Cleveland | 40.0% | 17,274 | 60.0% | 25,950 | 43,224 |
| Columbus | 46.0% | 11,088 | 54.0% | 12,998 | 24,086 |
| Craven | 42.8% | 17,335 | 57.2% | 23,163 | 40,498 |
| Cumberland | 58.9% | 73,926 | 41.1% | 51,596 | 125,522 |
| Currituck | 34.0% | 3,685 | 66.0% | 7,159 | 10,844 |
| Dare | 44.6% | 7,760 | 55.4% | 9,621 | 17,381 |
| Davidson | 33.0% | 22,192 | 67.0% | 45,135 | 67,327 |
| Davie | 30.6% | 6,102 | 69.4% | 13,846 | 19,948 |
| Duplin | 45.2% | 8,866 | 54.8% | 10,734 | 19,600 |
| Durham | 76.1% | 102,237 | 23.9% | 32,040 | 134,277 |
| Edgecombe | 67.4% | 17,365 | 32.6% | 8,416 | 25,781 |
| Forsyth | 55.3% | 90,712 | 44.7% | 73,304 | 164,016 |
| Franklin | 49.7% | 13,022 | 50.3% | 13,183 | 26,205 |
| Gaston | 37.4% | 31,247 | 62.6% | 52,220 | 83,467 |
| Gates | 52.6% | 2,827 | 47.4% | 2,546 | 5,373 |
| Graham | 30.9% | 1,265 | 69.1% | 2,824 | 4,089 |
| Granville | 53.4% | 13,010 | 46.6% | 11,373 | 24,383 |
| Greene | 47.0% | 3,774 | 53.0% | 4,258 | 8,032 |
| Guilford | 59.2% | 141,680 | 40.8% | 97,511 | 239,191 |
| Halifax | 63.9% | 15,726 | 36.1% | 8,867 | 24,593 |
| Harnett | 41.5% | 16,519 | 58.5% | 23,311 | 39,830 |
| Haywood | 46.1% | 12,724 | 53.9% | 14,902 | 27,626 |
| Henderson | 39.4% | 20,062 | 60.6% | 30,903 | 50,965 |
| Hertford | 70.8% | 7,479 | 29.2% | 3,083 | 10,562 |
| Hoke | 59.6% | 9,133 | 40.4% | 6,197 | 15,330 |
| Hyde | 50.5% | 1,225 | 49.5% | 1,203 | 2,428 |
| Iredell | 37.7% | 27,201 | 62.3% | 44,979 | 72,180 |
| Jackson | 52.7% | 8,671 | 47.3% | 7,793 | 16,464 |
| Johnston | 38.0% | 26,475 | 62.0% | 43,164 | 69,639 |
| Jones | 45.7% | 2,364 | 54.3% | 2,807 | 5,171 |
| Lee | 45.8% | 10,703 | 54.2% | 12,652 | 23,355 |
| Lenoir | 49.8% | 13,157 | 50.2% | 13,281 | 26,438 |
| Lincoln | 33.1% | 11,674 | 66.9% | 23,561 | 35,235 |
| Macon | 39.2% | 6,603 | 60.8% | 10,262 | 16,865 |
| Madison | 49.2% | 5,011 | 50.8% | 5,175 | 10,186 |
| Martin | 52.3% | 6,488 | 47.7% | 5,914 | 12,402 |
| McDowell | 36.4% | 6,514 | 63.6% | 11,382 | 17,896 |
| Mecklenburg | 62.3% | 252,642 | 37.7% | 152,957 | 405,599 |
| Mitchell | 28.9% | 2,220 | 71.1% | 5,472 | 7,692 |
| Montgomery | 44.3% | 4,870 | 55.7% | 6,125 | 10,995 |
| Moore | 39.2% | 17,534 | 60.8% | 27,165 | 44,699 |
| Nash | 49.3% | 23,013 | 50.7% | 23,660 | 46,673 |
| New Hanover | 49.3% | 48,588 | 50.7% | 50,004 | 98,592 |
| Northampton | 65.3% | 6,893 | 34.7% | 3,662 | 10,555 |
| Onslow | 39.2% | 19,296 | 60.8% | 29,942 | 49,238 |
| Orange | 72.6% | 53,712 | 27.4% | 20,226 | 73,938 |
| Pamlico | 42.5% | 2,820 | 57.5% | 3,809 | 6,629 |
| Pasquotank | 56.8% | 10,170 | 43.2% | 7,720 | 17,890 |
| Pender | 42.1% | 9,832 | 57.9% | 13,517 | 23,349 |
| Perquimans | 42.9% | 2,761 | 57.1% | 3,674 | 6,435 |
| Person | 45.7% | 8,410 | 54.3% | 10,007 | 18,417 |
| Pitt | 54.3% | 39,763 | 45.7% | 33,429 | 73,192 |
| Polk | 42.3% | 4,394 | 57.7% | 5,986 | 10,380 |
| Randolph | 28.6% | 16,280 | 71.4% | 40,644 | 56,924 |
| Richmond | 50.7% | 9,586 | 49.3% | 9,316 | 18,902 |
| Robeson | 56.9% | 22,315 | 43.1% | 16,883 | 39,198 |
| Rockingham | 42.7% | 16,730 | 57.3% | 22,435 | 39,165 |
| Rowan | 38.4% | 23,272 | 61.6% | 37,284 | 60,556 |
| Rutherford | 34.0% | 9,595 | 66.0% | 18,631 | 28,226 |
| Sampson | 45.7% | 11,753 | 54.3% | 13,952 | 25,705 |
| Scotland | 57.6% | 8,105 | 42.4% | 5,972 | 14,077 |
| Stanly | 31.5% | 8,815 | 68.5% | 19,193 | 28,008 |
| Stokes | 32.2% | 6,816 | 67.8% | 14,335 | 21,151 |
| Surry | 35.9% | 10,399 | 64.1% | 18,574 | 28,973 |
| Swain | 49.2% | 2,803 | 50.8% | 2,896 | 5,699 |
| Transylvania | 43.6% | 7,203 | 56.4% | 9,299 | 16,502 |
| Tyrrell | 49.3% | 932 | 50.7% | 960 | 1,892 |
| Union | 36.5% | 31,038 | 63.5% | 53,882 | 84,920 |
| Vance | 63.3% | 13,095 | 36.7% | 7,584 | 20,679 |
| Wake | 57.5% | 247,914 | 42.5% | 183,291 | 431,205 |
| Warren | 69.0% | 6,663 | 31.0% | 2,992 | 9,655 |
| Washington | 58.3% | 3,734 | 41.7% | 2,667 | 6,401 |
| Watauga | 52.2% | 14,513 | 47.8% | 13,303 | 27,816 |
| Wayne | 45.6% | 22,507 | 54.4% | 26,800 | 49,307 |
| Wilkes | 30.6% | 8,889 | 69.4% | 20,152 | 29,041 |
| Wilson | 51.9% | 19,754 | 48.1% | 18,338 | 38,092 |
| Yadkin | 26.7% | 4,501 | 73.3% | 12,355 | 16,856 |
| Yancey | 47.1% | 4,470 | 52.9% | 5,021 | 9,491 |
Source: http://elections.nytimes.com/2008/results/states/president/north-carolina.html
By congressional district
Despite Barack Obama winning North Carolina, John McCain carried seven of the state’s 13 congressional districts, including two districts represented by Democrats in the U.S. House of Representatives.
| District | McCain | Obama | Representative |
|---|---|---|---|
| 1st | 37.11% | 62.44% | G.K. Butterfield |
| 2nd | 47.29% | 51.91% | Bob Etheridge |
| 3rd | 61.37% | 37.83% | Walter B. Jones |
| 4th | 36.32% | 62.70% | David Price |
| 5th | 60.83% | 37.91% | Virginia Foxx |
| 6th | 62.76% | 36.20% | Howard Coble |
| 7th | 52.35% | 46.79% | Mike McIntyre |
| 8th | 46.68% | 52.56% | Robin Hayes (110th Congress) |
| Larry Kissell (111th Congress) | |||
| 9th | 54.46% | 44.75% | Sue Wilkins Myrick |
| 10th | 63.11% | 35.74% | Patrick T. McHenry |
| 11th | 52.12% | 46.50% | Heath Shuler |
| 12th | 28.93% | 70.42% | Mel Watt |
| 13th | 40.38% | 58.70% | Brad Miller |
Electors
Technically the voters of North Carolina cast their ballots for electors: representatives to the Electoral College. North Carolina is allocated 15 electors because it has 13 congressional districts and 2 senators. All candidates who appear on the ballot or qualify to receive write-in votes must submit a list of 15 electors, who pledge to vote for their candidate and his or her running mate. Whoever wins the majority of votes in the state is awarded all 15 electoral votes. Their chosen electors then vote for president and vice president. Although electors are pledged to their candidate and running mate, they are not obligated to vote for them.[21] An elector who votes for someone other than his or her candidate is known as a faithless elector.
The electors of each state and the District of Columbia met on December 15, 2008, to cast their votes for president and vice president. The Electoral College itself never meets as one body. Instead the electors from each state and the District of Columbia met in their respective capitols.
The following were the members of the Electoral College from the state. All 15 were pledged to Barack Obama and Joe Biden:[22]
- Janice Cole
- Louise Sewell
- Virginia Tillett
- Linda Gunter
- Timothy Futrelle
- Wayne Abraham
- Armin Ancis
- Wendy Wood
- Michael Cognac
- Dan DeHart
- Harley Caldwell
- Samuel Spencer
- Patricia Hawkins
- Sid Crawford
- Kara Hollingsworth
References
- ↑ D.C.'s Political Report: The complete source for campaign summaries
- ↑ Presidential | The Cook Political Report Archived May 5, 2015, at the Wayback Machine.
- ↑ Adnaan (2008-09-20). "Track the Electoral College vote predictions". The Takeaway. Archived from the original on April 22, 2009. Retrieved 2009-11-14.
- ↑ Election Projection: 2008 Elections - Polls, Projections, Results
- ↑ Electoral-vote.com: President, Senate, House Updated Daily
- 1 2 3 4 Based on Takeaway
- ↑ POLITICO's 2008 Swing State Map - POLITICO.com
- ↑ RealClearPolitics - Electoral Map
- ↑ CQ Politics | CQ Presidential Election Maps, 2008 Archived October 29, 2008, at the Wayback Machine.
- ↑ "Electoral College Map". The New York Times. Retrieved May 26, 2010.
- ↑ "October – 2008 – CNN Political Ticker - CNN.com Blogs". CNN. Retrieved May 26, 2010.
- ↑ "Winning the Electoral College". Fox News. April 27, 2010.
- ↑ roadto270
- ↑ Election 2008: Electoral College Update - Rasmussen Reports™
- ↑ Election 2008 Polls - Dave Leip's Atlas of U.S. Presidential Elections
- ↑ Presidential Campaign Finance
- ↑ "Map: Campaign Ad Spending - Election Center 2008 from CNN.com". CNN. Retrieved May 26, 2010.
- ↑ "Map: Campaign Candidate Visits - Election Center 2008 from CNN.com". CNN. Retrieved May 26, 2010.
- ↑ "Election Results 2008". New York Times. Archived from the original on November 3, 2004. Retrieved 2009-05-12.
- ↑ "How Black Democrats won North Carolina and the Election: Massive Turnout, Week of November 13–19, 2008". The Wilmington Journal. 2008-11-24.
- ↑ "Electoral College". California Secretary of State. Archived from the original on October 30, 2008. Retrieved 2008-11-01.
- ↑ North Carolina Certificate of Ascertainment, page 1 of 3.. National Archives and Record Administration.
See also
United States Senate election in North Carolina, 2008