Northampton County, North Carolina
| Northampton County, North Carolina | ||
|---|---|---|
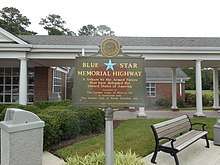 Blue Star Memorial Highway plaque at Interstate 95 North Carolina Welcome Center in Pleasant Hill Township. | ||
| ||
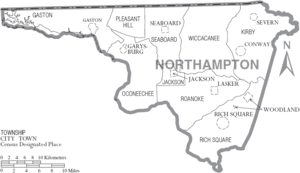
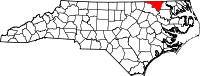 Location in the U.S. state of North Carolina | ||
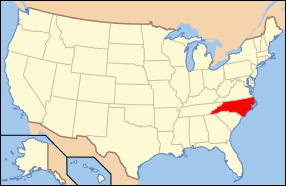 North Carolina's location in the U.S. | ||
| Founded | 1741 | |
| Named for | James Compton, 5th Earl of Northampton | |
| Seat | Jackson | |
| Largest town | Garysburg | |
| Area | ||
| • Total | 551 sq mi (1,427 km2) | |
| • Land | 537 sq mi (1,391 km2) | |
| • Water | 14 sq mi (36 km2), 2.5% | |
| Population | ||
| • (2010) | 22,099 | |
| • Density | 41/sq mi (16/km2) | |
| Congressional district | 1st | |
| Time zone | Eastern: UTC−5/−4 | |
| Website |
www | |

Northampton County is a county located in the U.S. state of North Carolina. As of the 2010 census, the population was 22,099.[1] Its county seat is Jackson.[2]
Northampton County is part of the Roanoke Rapids, NC Micropolitan Statistical Area, which is also included in the Rocky Mount-Wilson-Roanoke Rapids, NC Combined Statistical Area.
History
The county was formed in 1741 from Bertie County. It was named for James Compton, 5th Earl of Northampton. In 1759 parts of Northampton County, Bertie County, and Chowan County were combined to form Hertford County.
In 1959, the county went to the U.S. Supreme Court to defend the use of a literacy test as a requirement to vote. In Lassiter v. Northampton County Board of Elections, the court held that, provided the tests were applied equally to all races and were not "merely a device to make racial discrimination easy," they were allowable.[3] Congress subsequently prohibited use of such tests under the National Voting Rights Act of 1965.
Geography
According to the U.S. Census Bureau, the county has a total area of 551 square miles (1,430 km2), of which 537 square miles (1,390 km2) is land and 14 square miles (36 km2) (2.5%) is water.[4]
Adjacent counties
- Greensville County, Virginia - north
- Southampton County, Virginia - northeast
- Hertford County - east
- Bertie County - southeast
- Halifax County - southwest
- Warren County - northwest
- Brunswick County, Virginia - north-northwest
Major highways
Demographics
| Historical population | |||
|---|---|---|---|
| Census | Pop. | %± | |
| 1790 | 9,992 | — | |
| 1800 | 12,353 | 23.6% | |
| 1810 | 13,082 | 5.9% | |
| 1820 | 13,242 | 1.2% | |
| 1830 | 13,391 | 1.1% | |
| 1840 | 13,369 | −0.2% | |
| 1850 | 13,335 | −0.3% | |
| 1860 | 13,372 | 0.3% | |
| 1870 | 14,749 | 10.3% | |
| 1880 | 20,032 | 35.8% | |
| 1890 | 21,242 | 6.0% | |
| 1900 | 21,150 | −0.4% | |
| 1910 | 22,323 | 5.5% | |
| 1920 | 23,184 | 3.9% | |
| 1930 | 27,161 | 17.2% | |
| 1940 | 28,299 | 4.2% | |
| 1950 | 28,432 | 0.5% | |
| 1960 | 26,811 | −5.7% | |
| 1970 | 24,009 | −10.5% | |
| 1980 | 22,584 | −5.9% | |
| 1990 | 20,798 | −7.9% | |
| 2000 | 22,086 | 6.2% | |
| 2010 | 22,099 | 0.1% | |
| Est. 2016 | 20,000 | [5] | −9.5% |
| U.S. Decennial Census[6] 1790-1960[7] 1900-1990[8] 1990-2000[9] 2010-2013[1] | |||
As of the 2010 United States Census, there were 22,099 people residing in the county; 58.4% were Black or African American, 39.2% White, 0.5% Native American, 0.2% Asian, 0.8% of some other race and 1.0% of two or more races. 1.4% were Hispanic or Latino (of any race).
As of the census[10] of 2000, there were 22,086 people, 8,691 households, and 5,953 families residing in the county. The population density was 41 people per square mile (16/km²). There were 10,455 housing units at an average density of 20 per square mile (8/km²). The racial makeup of the county was 59.43% Black or African American, 39.09% White, 0.32% Native American, 0.09% Asian, 0.05% Pacific Islander, 0.39% from other races, and 0.63% from two or more races. 0.73% of the population were Hispanic or Latino of any race.
There were 8,691 households out of which 27.70% had children under the age of 18 living with them, 45.50% were married couples living together, 18.30% had a female householder with no husband present, and 31.50% were non-families. 28.40% of all households were made up of individuals and 13.20% had someone living alone who was 65 years of age or older. The average household size was 2.44 and the average family size was 2.99.
In the county, the population was spread out with 24.30% under the age of 18, 6.90% from 18 to 24, 26.50% from 25 to 44, 24.90% from 45 to 64, and 17.40% who were 65 years of age or older. The median age was 40 years. For every 100 females there were 92.00 males. For every 100 females age 18 and over, there were 88.60 males.
The median income for a household in the county was $26,652, and the median income for a family was $34,648. Males had a median income of $27,970 versus $21,183 for females. The per capita income for the county was $15,413. About 17.00% of families and 21.30% of the population were below the poverty line, including 29.80% of those under age 18 and 21.50% of those age 65 or over.
Communities
Towns
Unincorporated communities
Townships
- Gaston
- Jackson
- Kirby
- Occoneechee
- Pleasant Hill
- Rich Square
- Roanoke
- Seaboard
- Wiccanee
Law and government
Northampton County is a member of the regional Upper Coastal Plain Council of Governments.
Politics
Northampton is a traditionally Democratic county, being one of only two counties in the state won by George McGovern during his 1972 landslide loss.[11] Apart from several contiguous counties in South Texas;[a] Northampton County is the only county in the United States to vote Democrat at every election over the past century;[12] the last Democratic candidate to lose the county was William Jennings Bryan in 1896.[13] Apart from Hubert Humphrey and McGovern who received no more than 51 percent, every Democratic nominee in the past century has received at least 61 percent of the county’s vote.
| Year | Republican | Democratic | Third parties |
|---|---|---|---|
| 2016 | 36.4% 3,582 | 62.4% 6,144 | 1.2% 122 |
| 2012 | 32.4% 3,483 | 67.2% 7,232 | 0.4% 41 |
| 2008 | 34.6% 3,671 | 65.0% 6,903 | 0.4% 44 |
| 2004 | 36.2% 3,176 | 63.7% 5,584 | 0.1% 10 |
| 2000 | 32.5% 2,667 | 67.2% 5,513 | 0.2% 20 |
| 1996 | 25.1% 1,881 | 69.4% 5,207 | 5.5% 411 |
| 1992 | 23.2% 1,845 | 65.2% 5,195 | 11.6% 927 |
| 1988 | 34.3% 2,415 | 65.4% 4,599 | 0.3% 19 |
| 1984 | 38.4% 3,198 | 61.2% 5,094 | 0.5% 38 |
| 1980 | 26.9% 1,847 | 71.9% 4,933 | 1.2% 81 |
| 1976 | 19.4% 1,238 | 80.2% 5,118 | 0.4% 23 |
| 1972 | 47.7% 2,997 | 51.5% 3,233 | 0.8% 52 |
| 1968 | 10.9% 860 | 51.4% 4,072 | 37.7% 2,986 |
| 1964 | 19.0% 1,187 | 81.0% 5,046 | |
| 1960 | 12.5% 678 | 87.5% 4,756 | |
| 1956 | 15.0% 747 | 85.0% 4,242 | |
| 1952 | 11.9% 583 | 88.1% 4,334 | |
| 1948 | 4.6% 179 | 92.2% 3,591 | 3.2% 126 |
| 1944 | 4.7% 172 | 95.3% 3,470 | |
| 1940 | 2.7% 105 | 97.3% 3,826 | |
| 1936 | 2.8% 109 | 97.2% 3,785 | |
| 1932 | 4.3% 147 | 95.5% 3,243 | 0.2% 7 |
| 1928 | 20.9% 456 | 79.1% 1,723 | |
| 1924 | 7.9% 144 | 91.2% 1,662 | 0.9% 17 |
| 1920 | 6.7% 165 | 93.3% 2,305 | |
| 1916 | 2.9% 45 | 97.1% 1,518 | |
| 1912 | 3.3% 57 | 93.7% 1,625 | 3.1% 53 |
Northampton County is part of North Carolina's 1st congressional district, which has a Cook Partisan Voting Index of D+9 and has been represented by a Democratic Congressman since 1899. It is currently represented by G. K. Butterfield. In the North Carolina House of Representatives, Northampton County lies within the 27th District, which also covers Halifax County and is represented by Democrat Michael H. Wray. In the North Carolina Senate, Northampton County lies within the 3rd Senate District, represented by Democrat Erica Smith-Ingram.
See also
References
- 1 2 "State & County QuickFacts". United States Census Bureau. Retrieved October 27, 2013.
- ↑ "Find a County". National Association of Counties. Retrieved 2011-06-07.
- ↑ Lassiter v. Northampton County Board of Elections, 360 U.S. 45 (1959). Findlaw.com; retrieved 2010-12-07.
- ↑ "2010 Census Gazetteer Files". United States Census Bureau. August 22, 2012. Archived from the original on January 12, 2015. Retrieved January 18, 2015.
- ↑ "Population and Housing Unit Estimates". Retrieved June 9, 2017.
- ↑ "U.S. Decennial Census". United States Census Bureau. Retrieved January 18, 2015.
- ↑ "Historical Census Browser". University of Virginia Library. Retrieved January 18, 2015.
- ↑ Forstall, Richard L., ed. (March 27, 1995). "Population of Counties by Decennial Census: 1900 to 1990". United States Census Bureau. Retrieved January 18, 2015.
- ↑ "Census 2000 PHC-T-4. Ranking Tables for Counties: 1990 and 2000" (PDF). United States Census Bureau. April 2, 2001. Retrieved January 18, 2015.
- ↑ "American FactFinder". United States Census Bureau. Retrieved 2008-01-31.
- ↑ David Leip’s Presidential Atlas (Maps for North Carolina by election)
- ↑ Sullivan, Robert David; ‘How the Red and Blue Map Evolved Over the Past Century’; America Magazine, June 29, 2016
- ↑ "Presidential election of 1896 - Map by counties". geoelections.free.fr. Retrieved 2018-03-16.
- ↑ Leip, David. "Dave Leip's Atlas of U.S. Presidential Elections". uselectionatlas.org. Retrieved 2018-03-16.
Notes
a South Texas counties voting Democrat at every election since before World War I comprise (going clockwise from the north) Webb, Duval, Jim Hogg, Brooks and Starr Counties
External links
- Official Northampton County Chamber of Commerce
- Northampton County government official website
- Official Northampton County Health Department
- Northampton County Public Schools official website
- NCGenWeb Northampton County - free genealogy resources for the county
Places adjacent to Northampton County, North Carolina | ||||||||||
|---|---|---|---|---|---|---|---|---|---|---|
| ||||||||||
Municipalities and communities of Northampton County, North Carolina, United States | ||
|---|---|---|
| Towns |  | |
| Unincorporated communities | ||