Currituck County, North Carolina
| Currituck County, North Carolina | ||
|---|---|---|
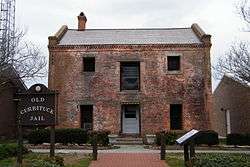
 Currituck County Courthouse | ||
| ||
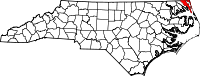 Location in the U.S. state of North Carolina | ||
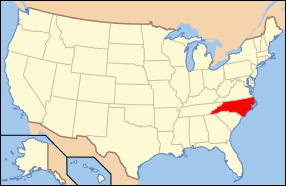 North Carolina's location in the U.S. | ||
| Founded | 1739 | |
| Named for | Algonquin term meaning "The Land of the Wild Goose"[1] | |
| Seat | Currituck | |
| Largest community | Moyock | |
| Area | ||
| • Total | 527 sq mi (1,365 km2) | |
| • Land | 262 sq mi (679 km2) | |
| • Water | 265 sq mi (686 km2), 50% | |
| Population | ||
| • (2010) | 23,547 | |
| • Density | 90/sq mi (30/km2) | |
| Congressional district | 3rd | |
| Time zone | Eastern: UTC−5/−4 | |
| Website |
www | |

Currituck County (/ˈkʊrɪtʌk/)[2] is the northeastern-most county in the U.S. state of North Carolina. As of the 2010 census, the population was 23,547.[3] Its county seat is Currituck.[4] The county was formed in 1668 as a precinct of Albemarle County and later gained county status in 1739.[5] The name is "traditionally said to be an Indian word for wild geese; Coratank."
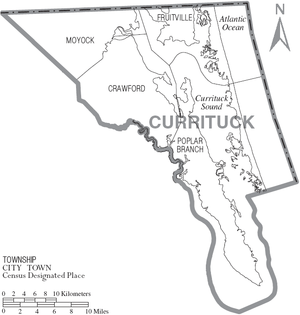
Currituck County is included in the Virginia Beach-Norfolk-Newport News, VA-NC Metropolitan Area. It is in the northeastern section of the state and is bounded by the Atlantic Ocean, Currituck Sound, Camden County, Dare County and the Commonwealth of Virginia. Currituck Court House, mentioned as early as 1755, was the name of the county seat. Today the words "Court House" have been dropped and only Currituck is used as the town name.
Geography

According to the U.S. Census Bureau, the county has a total area of 527 square miles (1,360 km2), of which 262 square miles (680 km2) is land and 265 square miles (690 km2) (50%) is water.[6]
Currituck County includes the northern communities of North Carolina's Outer Banks, separated from mainland Currituck County by the Currituck Sound.
National protected areas
Major highways
Demographics
| Historical population | |||
|---|---|---|---|
| Census | Pop. | %± | |
| 1790 | 5,220 | — | |
| 1800 | 6,928 | 32.7% | |
| 1810 | 6,985 | 0.8% | |
| 1820 | 8,098 | 15.9% | |
| 1830 | 7,655 | −5.5% | |
| 1840 | 6,703 | −12.4% | |
| 1850 | 7,236 | 8.0% | |
| 1860 | 7,415 | 2.5% | |
| 1870 | 5,131 | −30.8% | |
| 1880 | 6,476 | 26.2% | |
| 1890 | 6,747 | 4.2% | |
| 1900 | 6,529 | −3.2% | |
| 1910 | 7,693 | 17.8% | |
| 1920 | 7,268 | −5.5% | |
| 1930 | 6,710 | −7.7% | |
| 1940 | 6,709 | 0.0% | |
| 1950 | 6,201 | −7.6% | |
| 1960 | 6,601 | 6.5% | |
| 1970 | 6,976 | 5.7% | |
| 1980 | 11,089 | 59.0% | |
| 1990 | 13,736 | 23.9% | |
| 2000 | 18,190 | 32.4% | |
| 2010 | 23,547 | 29.5% | |
| Est. 2016 | 25,809 | [7] | 9.6% |
| U.S. Decennial Census[8] 2013 Estimate[3] | |||
As of the census[9] of 2010, there were 23,547 people, 6,902 households, and 5,204 families residing in the county. The population density was 70 people per square mile (27/km²). There were 10,687 housing units at an average density of 41 per square mile (16/km²). The racial makeup of the county was 90.3% White, 5.8% Black or African American, 0.5% Native American, 0.6% Asian, 0.0% Pacific Islander, 0.9% from other races, and 1.8% from two or more races. 3.0% of the population were Hispanics or Latinos of any race.
There were 6,902 households out of which 33.60% had children under the age of 18 living with them, 61.60% were married couples living together, 9.20% had a female householder with no husband present, and 24.60% were non-families. 19.40% of all households were made up of individuals and 7.60% had someone living alone who was 65 years of age or older. The average household size was 2.61 and the average family size was 2.98.
The age distribution was 25.30% under the age of 18, 6.70% from 18 to 24, 30.50% from 25 to 44, 25.40% from 45 to 64, and 12.00% who were 65 years of age or older. The median age was 38 years. For every 100 females there were 98.60 males. For every 100 females age 18 and over, there were 97.50 males.
The median income for a household in the county was $40,822, and the median income for a family was $46,382. Males had a median income of $32,619 versus $22,641 for females. The per capita income for the county was $19,908. 10.70% of the population and 8.90% of families were below the poverty line. Out of the total people living in poverty, 16.10% are under the age of 18 and 8.90% are 65 or older.
Communities
Census-designated places
Other unincorporated communities
- Aydlett
- Barco
- Carova Beach
- Corolla
- Currituck (county seat)
- Grandy
- Gregory
- Harbinger
- Knotts Island
- Jarvisburg
- Mamie
- Maple
- Point Harbor
- Poplar Beach
- Poplar Branch
- Powells Point
- Shawboro
- Sligo
- Spot
- Waterlily
Politics, law and government
Politically Currituck is a typical “Solid South” county. It voted more than eighty percent for every Democratic candidate between 1920 and 1948. Currituck never voted Republican until, after voting for American Independent George Wallace in 1968, turning decisively to Richard Nixon in 1972. Since then, Currituck has become a powerfully Republican county. The last Democrat to carry Currituck has been Jimmy Carter in 1980, and at the 2016 election Hillary Clinton received less than a quarter of the county’s vote.
The county is run by elected county commissioners, and Currituck County is a member of the Albemarle Commission regional council of governments. The Board of Commissioners banned further solar farms in February 2017.[10]
| Year | Republican | Democratic | Third parties |
|---|---|---|---|
| 2016 | 72.3% 9,163 | 23.0% 2,913 | 4.7% 593 |
| 2012 | 66.3% 7,496 | 31.5% 3,562 | 2.2% 246 |
| 2008 | 65.2% 7,234 | 33.7% 3,737 | 1.2% 131 |
| 2004 | 67.0% 6,013 | 32.4% 2,909 | 0.6% 54 |
| 2000 | 60.8% 4,095 | 38.5% 2,595 | 0.7% 49 |
| 1996 | 45.5% 2,569 | 40.3% 2,277 | 14.2% 799 |
| 1992 | 41.3% 2,188 | 36.5% 1,935 | 22.2% 1,174 |
| 1988 | 61.0% 2,443 | 38.8% 1,555 | 0.2% 8 |
| 1984 | 63.2% 2,885 | 36.6% 1,668 | 0.2% 9 |
| 1980 | 44.1% 1,668 | 52.3% 1,980 | 3.6% 138 |
| 1976 | 32.1% 954 | 67.3% 1,999 | 0.6% 17 |
| 1972 | 66.7% 1,578 | 30.3% 718 | 3.0% 71 |
| 1968 | 14.1% 363 | 28.7% 738 | 57.2% 1,471 |
| 1964 | 33.7% 741 | 66.3% 1,455 | |
| 1960 | 21.9% 464 | 78.1% 1,651 | |
| 1956 | 25.5% 488 | 74.5% 1,425 | |
| 1952 | 22.0% 414 | 78.0% 1,471 | |
| 1948 | 9.5% 130 | 83.6% 1,144 | 6.9% 94 |
| 1944 | 18.1% 231 | 82.0% 1,049 | |
| 1940 | 6.2% 102 | 93.8% 1,532 | |
| 1936 | 7.3% 128 | 92.7% 1,625 | |
| 1932 | 3.8% 69 | 96.0% 1,759 | 0.2% 4 |
| 1928 | 11.7% 166 | 88.3% 1,253 | |
| 1924 | 7.1% 52 | 91.2% 670 | 1.8% 13 |
| 1920 | 7.9% 86 | 92.1% 1,000 | |
| 1916 | 8.4% 87 | 91.5% 945 | 0.1% 1 |
| 1912 | 0.9% 6 | 97.8% 622 | 1.3% 8 |
Education
Currituck County Schools are governed by a five-member, elected Board of Education. The following schools are located in the county:
- Central Elementary School
- Currituck County High School
- Currituck County Middle School
- J.P. Knapp Early College High School
- Jarvisburg Elementary School
- Knotts Island Elementary School
- Moyock Elementary School
- Moyock Middle School
- Shawboro Elementary School
- W.T. Griggs Elementary School
- Jarvisburg Christian Academy
Notable people
- Dennis Anderson, driver of the Grave Digger monster truck.
- Emerson Etheridge, congressman and Southern Unionist
- Joseph P. Knapp, publisher, philanthropist and namesake of the J.P. Knapp Early College High School.
- Jared Lloyd, professional wildlife photographer, environmental writer, and author
See also
References
- ↑ History of Currituck County
- ↑ Talk Like A Tarheel, from the North Carolina Collection's website at the University of North Carolina at Chapel Hill. Retrieved 2013-02-05.
- 1 2 "State & County QuickFacts". United States Census Bureau. Retrieved October 18, 2013.
- ↑ "Find a County". National Association of Counties. Archived from the original on 2011-05-31. Retrieved 2011-06-07.
- ↑ "North Carolina: Individual County Chronologies". North Carolina Atlas of Historical County Boundaries. The Newberry Library. 2009. Retrieved January 22, 2015.
- ↑ "2010 Census Gazetteer Files". United States Census Bureau. August 22, 2012. Archived from the original on January 12, 2015. Retrieved January 13, 2015.
- ↑ "Population and Housing Unit Estimates". Retrieved June 9, 2017.
- ↑ "U.S. Decennial Census". Census.gov. Archived from the original on May 12, 2015. Retrieved October 18, 2013.
- ↑ "American FactFinder". United States Census Bureau. Archived from the original on 2013-09-11. Retrieved 2008-01-31.
- ↑ "Currituck County bans solar farm development". Virginian-Pilot. 21 February 2017. Retrieved 24 February 2017.
- ↑ Leip, David. "Dave Leip's Atlas of U.S. Presidential Elections". uselectionatlas.org. Retrieved 2018-03-15.
External links
- Currituck County Government website
- Currituck County Department of Travel and Tourism
- The Independent, local newspaper
Places adjacent to Currituck County, North Carolina | ||||||||||
|---|---|---|---|---|---|---|---|---|---|---|
| ||||||||||
Municipalities and communities of Currituck County, North Carolina, United States | ||
|---|---|---|
| CDPs | 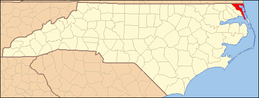 | |
| Unincorporated communities | ||