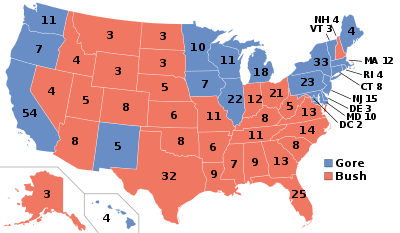
The 2000 United States presidential election in North Carolina took place on November 7, 2000, and was part of the 2000 United States presidential election. Voters chose 14 representatives, or electors to the Electoral College, who voted for president and vice president.
North Carolina was won by Governor George W. Bush with a double-digit margin of victory. Bush won most of the counties and congressional districts of the state. He won 9 of the 12 districts. He also won the most populated counties of the state including Forsyth County with 56%, Wake County with 53%, Guilford County with 51%, and Mecklenburg County with 51% of the vote.[1] As of the 2016 presidential election, this is the last election in which Guilford County and Mecklenburg County voted for the Republican candidate and the last election in which Columbus County, Chowan County, and Tyrrell County voted for the Democratic candidate.
Results
By county
| County |
Gore% |
Gore# |
Bush% |
Bush# |
Others% |
Others# |
Total |
| Alamance County | 37.08% | 17,459 | 62.23% | 29,305 | 00.69% | 327 | 47,091 |
| Alexander County | 30.88% | 4,166 | 68.50% | 9,242 | 00.62% | 84 | 13,492 |
| Alleghany County | 39.76% | 1,715 | 58.68% | 2,531 | 01.55% | 67 | 4,313 |
| Anson County | 60.01% | 4,792 | 39.59% | 3,161 | 00.40% | 32 | 7,985 |
| Ashe County | 38.88% | 4,011 | 60.35% | 6,226 | 00.77% | 79 | 10,316 |
| Avery County | 25.19% | 1,686 | 74.04% | 4,956 | 00.78% | 52 | 6,694 |
| Beaufort County | 38.32% | 6,634 | 60.83% | 10,531 | 00.85% | 148 | 17,313 |
| Bertie County | 64.94% | 4,660 | 34.67% | 2,488 | 00.39% | 28 | 7,176 |
| Bladen County | 53.99% | 5,889 | 45.63% | 4,977 | 00.39% | 42 | 10,908 |
| Brunswick County | 45.49% | 13,118 | 53.49% | 15,427 | 01.02% | 294 | 28,839 |
| Buncombe County | 45.09% | 38,545 | 53.93% | 46,101 | 00.97% | 830 | 85,476 |
| Burke County | 38.89% | 11,924 | 60.23% | 18,466 | 00.87% | 268 | 30,658 |
| Cabarrus County | 32.89% | 16,284 | 66.05% | 32,704 | 01.07% | 529 | 49,517 |
| Caldwell County | 32.89% | 8,588 | 66.39% | 17,337 | 00.73% | 190 | 26,115 |
| Camden County | 41.93% | 1,187 | 57.51% | 1,628 | 00.57% | 16 | 2,831 |
| Carteret County | 33.25% | 8,839 | 65.39% | 17,381 | 01.35% | 360 | 26,580 |
| Caswell County | 48.58% | 4,091 | 50.70% | 4,270 | 00.72% | 61 | 8,422 |
| Catawba County | 31.95% | 16,246 | 67.36% | 34,244 | 00.69% | 351 | 50,841 |
| Chatham County | 49.98% | 10,461 | 48.96% | 10,248 | 01.06% | 222 | 20,931 |
| Cherokee County | 33.48% | 3,239 | 65.17% | 6,305 | 01.34% | 130 | 9,674 |
| Chowan County | 49.69% | 2,430 | 49.39% | 2,415 | 00.92% | 45 | 4,890 |
| Clay County | 35.33% | 1,361 | 62.72% | 2,416 | 01.95% | 75 | 3,852 |
| Cleveland County | 41.09% | 13,455 | 58.22% | 19,064 | 00.69% | 227 | 32,746 |
| Columbus County | 54.20% | 9,986 | 45.28% | 8,342 | 00.53% | 97 | 18,425 |
| Craven County | 38.18% | 12,213 | 60.95% | 19,494 | 00.87% | 278 | 31,985 |
| Cumberland County | 50.07% | 38,626 | 49.42% | 38,129 | 00.51% | 396 | 77,151 |
| Currituck County | 38.51% | 2,595 | 60.77% | 4,095 | 00.73% | 49 | 6,739 |
| Dare County | 42.99% | 5,589 | 56.15% | 7,301 | 00.86% | 112 | 13,002 |
| Davidson County | 31.12% | 16,199 | 67.99% | 35,387 | 00.89% | 461 | 52,047 |
| Davie County | 26.08% | 3,651 | 72.75% | 10,184 | 01.16% | 163 | 13,998 |
| Duplin County | 45.00% | 6,475 | 54.48% | 7,840 | 00.52% | 75 | 14,390 |
| Durham County | 63.27% | 53,907 | 35.39% | 30,150 | 01.34% | 1,144 | 85,201 |
| Edgecombe County | 62.16% | 11,315 | 37.56% | 6,836 | 00.28% | 51 | 18,202 |
| Forsyth County | 43.37% | 52,457 | 55.98% | 67,700 | 00.65% | 785 | 120,942 |
| Franklin County | 46.44% | 7,454 | 52.96% | 8,501 | 00.60% | 96 | 16,051 |
| Gaston County | 32.58% | 19,281 | 66.67% | 39,453 | 00.75% | 445 | 59,179 |
| Gates County | 56.41% | 1,944 | 42.95% | 1,480 | 00.64% | 22 | 3,446 |
| Graham County | 29.93% | 1,006 | 68.55% | 2,304 | 01.52% | 51 | 3,361 |
| Granville County | 50.90% | 7,733 | 48.47% | 7,364 | 00.64% | 97 | 15,194 |
| Greene County | 42.21% | 2,478 | 57.12% | 3,353 | 00.66% | 39 | 5,870 |
| Guilford County | 48.59% | 80,787 | 50.76% | 84,394 | 00.65% | 1,083 | 166,264 |
| Halifax County | 60.24% | 10,222 | 39.47% | 6,698 | 00.29% | 50 | 16,970 |
| Harnett County | 37.88% | 9,155 | 61.08% | 14,762 | 01.03% | 250 | 24,167 |
| Haywood County | 41.05% | 9,793 | 50.79% | 12,118 | 08.16% | 1,946 | 23,857 |
| Henderson County | 32.54% | 12,562 | 66.54% | 25,688 | 00.92% | 357 | 38,607 |
| Hertford County | 69.44% | 5,484 | 30.16% | 2,382 | 00.39% | 31 | 7,897 |
| Hoke County | 58.46% | 5,017 | 40.07% | 3,439 | 01.47% | 126 | 8,582 |
| Hyde County | 48.64% | 1,088 | 50.60% | 1,132 | 00.76% | 17 | 2,237 |
| Iredell County | 33.86% | 15,434 | 65.49% | 29,853 | 00.66% | 299 | 45,586 |
| Jackson County | 47.21% | 5,722 | 51.46% | 6,237 | 01.34% | 162 | 12,121 |
| Johnston County | 33.30% | 13,704 | 66.12% | 27,212 | 00.58% | 239 | 41,155 |
| Jones County | 45.96% | 1,822 | 53.33% | 2,114 | 00.71% | 28 | 3,964 |
| Lee County | 41.67% | 6,785 | 57.77% | 9,406 | 00.57% | 92 | 16,283 |
| Lenoir County | 45.02% | 9,527 | 54.40% | 11,512 | 00.59% | 124 | 21,163 |
| Lincoln County | 34.29% | 8,412 | 65.03% | 15,951 | 00.68% | 166 | 24,529 |
| Macon County | 35.39% | 4,683 | 63.52% | 8,406 | 01.10% | 145 | 13,234 |
| Madison County | 42.10% | 3,505 | 56.17% | 4,676 | 01.73% | 144 | 8,325 |
| Martin County | 52.63% | 4,929 | 47.19% | 4,420 | 00.18% | 17 | 9,366 |
| McDowell County | 33.88% | 4,747 | 65.01% | 9,109 | 01.11% | 155 | 14,011 |
| Mecklenburg County | 48.25% | 126,911 | 50.97% | 134,068 | 00.78% | 2,057 | 263,036 |
| Mitchell County | 23.26% | 1,535 | 75.52% | 4,984 | 01.23% | 81 | 6,600 |
| Montgomery County | 44.34% | 3,979 | 55.11% | 4,946 | 00.55% | 49 | 8,974 |
| Moore County | 35.88% | 11,232 | 63.52% | 19,882 | 00.60% | 187 | 31,301 |
| Nash County | 40.56% | 12,376 | 58.97% | 17,995 | 00.47% | 142 | 30,513 |
| New Hanover County | 44.17% | 29,292 | 55.04% | 36,503 | 00.79% | 524 | 66,319 |
| Northampton County | 67.23% | 5,513 | 32.52% | 2,667 | 00.24% | 20 | 8,200 |
| Onslow County | 33.99% | 10,269 | 65.06% | 19,657 | 00.96% | 289 | 30,215 |
| Orange County | 62.66% | 30,921 | 36.34% | 17,930 | 01.00% | 493 | 49,344 |
| Pamlico County | 41.74% | 2,188 | 57.21% | 2,999 | 01.05% | 55 | 5,242 |
| Pasquotank County | 53.88% | 5,874 | 45.34% | 4,943 | 00.79% | 86 | 10,903 |
| Pender County | 45.32% | 6,415 | 54.13% | 7,661 | 00.55% | 78 | 14,154 |
| Perquimans County | 47.21% | 2,033 | 51.79% | 2,230 | 01.00% | 43 | 4,306 |
| Person County | 42.61% | 5,042 | 56.81% | 6,722 | 00.58% | 69 | 11,833 |
| Pitt County | 45.70% | 19,685 | 53.84% | 23,192 | 00.46% | 198 | 43,075 |
| Polk County | 37.50% | 3,114 | 61.11% | 5,074 | 01.39% | 115 | 8,303 |
| Randolph County | 26.62% | 11,366 | 72.51% | 30,959 | 00.87% | 371 | 42,696 |
| Richmond County | 55.61% | 7,935 | 43.89% | 6,263 | 00.50% | 71 | 14,269 |
| Robeson County | 59.95% | 17,834 | 39.40% | 11,721 | 00.65% | 192 | 29,747 |
| Rockingham County | 40.76% | 13,260 | 58.35% | 18,979 | 00.89% | 289 | 32,528 |
| Rowan County | 33.74% | 14,891 | 65.53% | 28,922 | 00.73% | 320 | 44,133 |
| Rutherford County | 35.44% | 7,697 | 63.34% | 13,755 | 01.22% | 264 | 21,716 |
| Sampson County | 45.57% | 8,768 | 54.11% | 10,410 | 00.32% | 61 | 19,239 |
| Scotland County | 59.84% | 5,627 | 39.77% | 3,740 | 00.38% | 36 | 9,403 |
| Stanly County | 30.97% | 7,066 | 68.14% | 15,548 | 00.89% | 204 | 22,818 |
| Stokes County | 29.27% | 5,030 | 70.00% | 12,028 | 00.72% | 124 | 17,182 |
| Surry County | 33.21% | 7,757 | 65.93% | 15,401 | 00.86% | 200 | 23,358 |
| Swain County | 47.99% | 2,097 | 50.89% | 2,224 | 01.12% | 49 | 4,370 |
| Transylvania County | 35.46% | 5,044 | 63.35% | 9,011 | 01.20% | 170 | 14,225 |
| Tyrrell County | 54.21% | 849 | 45.08% | 706 | 00.70% | 11 | 1,566 |
| Union County | 31.49% | 14,890 | 67.41% | 31,876 | 01.10% | 522 | 47,288 |
| Vance County | 55.84% | 7,092 | 43.81% | 5,564 | 00.35% | 45 | 12,701 |
| Wake County | 45.83% | 123,466 | 52.90% | 142,494 | 01.27% | 3,425 | 269,385 |
| Warren County | 67.34% | 4,576 | 32.41% | 2,202 | 00.25% | 17 | 6,795 |
| Washington County | 55.30% | 2,704 | 44.36% | 2,169 | 00.35% | 17 | 4,890 |
| Watauga County | 42.51% | 7,959 | 55.75% | 10,438 | 01.74% | 326 | 18,723 |
| Wayne County | 38.38% | 13,005 | 61.26% | 20,758 | 00.36% | 121 | 33,884 |
| Wilkes County | 29.71% | 7,226 | 69.18% | 16,826 | 01.11% | 271 | 24,323 |
| Wilson County | 45.38% | 11,266 | 54.24% | 13,466 | 00.38% | 94 | 24,826 |
| Yadkin County | 22.85% | 3,127 | 76.27% | 10,435 | 00.88% | 120 | 13,682 |
| Yancey County | 42.38% | 3,714 | 56.71% | 4,970 | 00.91% | 80 | 8,764 |
Electors
Technically the voters of North Carolina cast their ballots for electors: representatives to the Electoral College. North Carolina is allocated 14 electors because it has 12 congressional districts and 2 senators. All candidates who appear on the ballot or qualify to receive write-in votes must submit a list of 14 electors, who pledge to vote for their candidate and his or her running mate. Whoever wins the majority of votes in the state is awarded all 14 electoral votes. Their chosen electors then vote for president and vice president. Although electors are pledged to their candidate and running mate, they are not obligated to vote for them. An elector who votes for someone other than his or her candidate is known as a faithless elector.
The electors of each state and the District of Columbia met on December 18, 2000[2] to cast their votes for president and vice president. The Electoral College itself never meets as one body. Instead the electors from each state and the District of Columbia met in their respective capitols.
The following were the members of the Electoral College from the state. All were pledged to and voted for George W. Bush and Dick Cheney:[3]
- Fran Barnhart
- Claude Billings
- Sam Currin
- Tom Dwiggins
- A. Dial Gray
- Barbara Holt
- Marshall Hurley
- Margaret King
- Jeff Mixon
- Joe L. Morgan
- Steve Rader
- Robert Rector
- Dewitt Rhoades
- Linda Young
References
|
|---|
| Candidates | | |
|---|
General
articles | |
|---|
Local
results | |
|---|
Other 2000
elections | |
|---|