Brunswick County, North Carolina
Coordinates: 34°02′N 78°13′W / 34.04°N 78.22°W
| Brunswick County, North Carolina | ||
|---|---|---|
 | ||
| ||
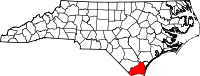 Location in the U.S. state of North Carolina | ||
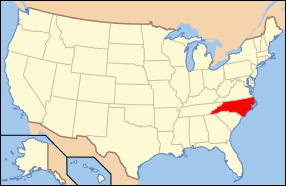 North Carolina's location in the U.S. | ||
| Founded | 1764 | |
| Named for | Duchy of Brunswick-Lüneburg | |
| Seat | Bolivia | |
| Largest town | Leland | |
| Area | ||
| • Total | 1,050 sq mi (2,719 km2) | |
| • Land | 847 sq mi (2,194 km2) | |
| • Water | 203 sq mi (526 km2), 19% | |
| Population | ||
| • (2010) | 107,431 | |
| • Density | 127/sq mi (49/km2) | |
| Congressional district | 7th | |
| Time zone | Eastern: UTC−5/−4 | |
| Website |
www | |

Brunswick County is the southernmost county in the U.S. state of North Carolina. As of the 2010 census, the population was 107,431.[1] As its population was only 73,143 in 2000, that makes it one of the fastest growing counties in the state, at a nominal growth rate of about 47% in ten years, with much of the growth centered in the eastern section of the county, the suburbs of Wilmington such as Leland, Belville and Southport. The county seat is Bolivia, which at a population of around 150 people is among the least populous county seats in the state. [2]
Brunswick County is included in the Myrtle Beach-Conway-North Myrtle Beach, SC-NC Metropolitan Statistical Area. It was formerly part of the Wilmington, NC Metropolitan Statistical Area. Wilmington area leaders disputed the change, but unsuccessfully.[3]
Much of the economy of the county is built around tourism, with beach communities lying along the south-facing beaches past Cape Fear such as Bald Head Island (the southernmost point of North Carolina) and Oak Island being popular destinations. Calabash, on the border of South Carolina, is renowned for its fried seafood, with "Calabash-style" restaurants dotting the region. The proximity to EUE/Screen Gems Studios in nearby Wilmington has made Brunswick County a popular filming location for many movies and TV shows.
History
The county was formed in 1764 from parts of Bladen County and New Hanover County. It was named for the colonial port of Brunswick Town (now in ruins) which itself was named for Duchy of Brunswick-Lüneburg; at the time held by the British kings of the House of Hanover.
Geography
According to the U.S. Census Bureau, the county has a total area of 1,050 square miles (2,700 km2), of which 847 square miles (2,190 km2) is land and 203 square miles (530 km2) (19%) is water.[4] It is the fourth-largest county in North Carolina by total area. The Brunswick River and the Cape Fear River provide access to the Atlantic Ocean.
The Brunswick Nuclear Generating Station is to the north of Southport.
Hydrogeology
The principal ground-water-supply sources for Brunswick County are the surficial aquifer for domestic supplies and the Castle Hayne aquifer for municipal supplies.[5]
Beaches
Islands
Major highways
Demographics
| Historical population | |||
|---|---|---|---|
| Census | Pop. | %± | |
| 1790 | 3,071 | — | |
| 1800 | 4,110 | 33.8% | |
| 1810 | 4,778 | 16.3% | |
| 1820 | 5,480 | 14.7% | |
| 1830 | 6,516 | 18.9% | |
| 1840 | 6,255 | −4.0% | |
| 1850 | 7,272 | 16.3% | |
| 1860 | 8,406 | 15.6% | |
| 1870 | 7,754 | −7.8% | |
| 1880 | 9,389 | 21.1% | |
| 1890 | 10,900 | 16.1% | |
| 1900 | 12,657 | 16.1% | |
| 1910 | 14,432 | 14.0% | |
| 1920 | 14,876 | 3.1% | |
| 1930 | 15,818 | 6.3% | |
| 1940 | 17,125 | 8.3% | |
| 1950 | 19,238 | 12.3% | |
| 1960 | 20,278 | 5.4% | |
| 1970 | 24,223 | 19.5% | |
| 1980 | 35,777 | 47.7% | |
| 1990 | 50,985 | 42.5% | |
| 2000 | 73,143 | 43.5% | |
| 2010 | 107,431 | 46.9% | |
| Est. 2016 | 126,953 | [6] | 18.2% |
| U.S. Decennial Census[7] 1790-1960[8] 1900-1990[9] 1990-2000[10] 2010-2013[1] | |||
As of the census[11] of 2000, there were 73,143 people, 30,438 households, and 22,037 families residing in the county. The population density was 86 people per square mile (33/km²). There were 51,431 housing units at an average density of 60 per square mile (23/km²). The racial makeup of the county was 82.30% White, 14.38% Black or African American, 0.68% Native American, 0.27% Asian, 0.04% Pacific Islander, 1.32% from other races, and 1.01% from two or more races. 2.68% of the population were Hispanic or Latino of any race.
There were 30,438 households out of which 25.70% had children under the age of 18 living with them, 58.10% were married couples living together, 10.20% had a female householder with no husband present, and 27.60% were non-families. 22.90% of all households were made up of individuals and 8.60% had someone living alone who was 65 years of age or older. The average household size was 2.38 and the average family size was 2.76.
In the county, the population was spread out with 21.20% under the age of 18, 7.00% from 18 to 24, 25.70% from 25 to 44, 29.20% from 45 to 64, and 16.90% who were 65 years of age or older. The median age was 42 years. For every 100 females there were 96.70 males. For every 100 females age 18 and over, there were 94.90 males.
The median income for a household in the county was $35,888, and the median income for a family was $42,037. Males had a median income of $30,138 versus $22,066 for females. The per capita income for the county was $19,857. About 9.50% of families and 12.60% of the population were below the poverty line, including 19.40% of those under age 18 and 8.10% of those age 65 or over.
Communities
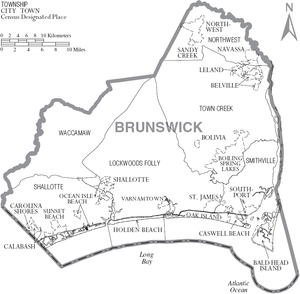
Cities
Towns
Villages
Townships
- Lockwood Folly
- Northwest
- Shallotte
- Smithville Township
- Town Creek
- Waccamaw
Unincorporated communities
Politics, law and government
Brunswick County is a member of the regional Cape Fear Council of Governments. The county lies in the inner coastal plain, most of which was highly pro-secession and part of the Democratic “Solid South”. However, Brunswick County was less fertile than the “Black Belt” and consequently had significant pro-Union and Populist sympathies, with the result that the county frequently backed Republicans at state and local levels even when the state was consistently Democratic apart from Herbert Hoover’s 1928 victory. Only three times since the Civil War – Grover Cleveland in 1888, Alton B. Parker in 1904 and Jimmy Carter in 1980[12] – has Brunswick County backed a losing Democratic presidential candidate. Carter in that 1980 election remains the last Democrat to win a majority of Brunswick County’s ballots, although Bill Clinton won a plurality in 1992.
| Year | Republican | Democratic | Third parties |
|---|---|---|---|
| 2016 | 62.5% 42,720 | 34.1% 23,282 | 3.4% 2,349 |
| 2012 | 60.6% 34,743 | 38.4% 22,038 | 1.0% 581 |
| 2008 | 58.5% 30,753 | 40.6% 21,331 | 1.0% 524 |
| 2004 | 60.4% 22,925 | 39.2% 14,903 | 0.4% 149 |
| 2000 | 53.5% 15,427 | 45.5% 13,118 | 1.0% 294 |
| 1996 | 45.7% 10,065 | 45.6% 10,041 | 8.7% 1,917 |
| 1992 | 39.4% 8,833 | 45.4% 10,177 | 15.1% 3,390 |
| 1988 | 55.8% 10,007 | 43.9% 7,881 | 0.3% 51 |
| 1984 | 58.7% 9,673 | 41.1% 6,774 | 0.3% 41 |
| 1980 | 45.4% 5,897 | 52.0% 6,761 | 2.7% 345 |
| 1976 | 32.9% 3,636 | 66.7% 7,377 | 0.5% 53 |
| 1972 | 69.1% 6,153 | 28.1% 2,500 | 2.9% 256 |
| 1968 | 27.5% 2,404 | 34.0% 2,972 | 38.5% 3,358 |
| 1964 | 46.7% 3,721 | 53.3% 4,240 | |
| 1960 | 40.4% 2,915 | 59.6% 4,305 | |
| 1956 | 50.0% 3,299 | 50.0% 3,297 | |
| 1952 | 50.1% 2,958 | 49.9% 2,951 | |
| 1948 | 40.5% 1,896 | 43.8% 2,052 | 15.7% 735 |
| 1944 | 46.0% 1,997 | 54.0% 2,346 | |
| 1940 | 35.9% 1,522 | 64.1% 2,717 | |
| 1936 | 37.5% 1,625 | 62.5% 2,710 | |
| 1932 | 44.3% 1,798 | 55.3% 2,245 | 0.4% 17 |
| 1928 | 65.5% 1,931 | 34.5% 1,018 | |
| 1924 | 52.8% 1,296 | 45.5% 1,118 | 1.7% 41 |
| 1920 | 52.1% 1,362 | 47.9% 1,253 | |
| 1916 | 54.9% 989 | 45.0% 810 | 0.1% 1 |
| 1912 | 18.5% 280 | 51.4% 777 | 30.1% 456 |
See also
References
- 1 2 "State & County QuickFacts". United States Census Bureau. Retrieved October 17, 2013.
- ↑ "Find a County". National Association of Counties. Archived from the original on 2011-05-31. Retrieved 2011-06-07.
- ↑ "Archived copy". Archived from the original on 2013-09-20. Retrieved 2013-05-11. Wilmington disputes move
- ↑ "2010 Census Gazetteer Files". United States Census Bureau. August 22, 2012. Archived from the original on January 12, 2015. Retrieved January 12, 2015.
- ↑ Harden, Stephen L. (2003). Hydrogeology and Ground-water Quality of Brunswick County, North Carolina. Raleigh, NC: U.S. Dept. of the Interior, U.S. Geological Survey. Retrieved 3 February 2018.
- ↑ "Population and Housing Unit Estimates". Retrieved June 9, 2017.
- ↑ "U.S. Decennial Census". United States Census Bureau. Archived from the original on May 12, 2015. Retrieved January 12, 2015.
- ↑ "Historical Census Browser". University of Virginia Library. Retrieved January 12, 2015.
- ↑ Forstall, Richard L., ed. (March 27, 1995). "Population of Counties by Decennial Census: 1900 to 1990". United States Census Bureau. Retrieved January 12, 2015.
- ↑ "Census 2000 PHC-T-4. Ranking Tables for Counties: 1990 and 2000" (PDF). United States Census Bureau. April 2, 2001. Retrieved January 12, 2015.
- ↑ "American FactFinder". United States Census Bureau. Archived from the original on 2013-09-11. Retrieved 2008-01-31.
- ↑ Melendez, Albert J.; The Geography of Presidential Elections in the United States, 1868-2004, pp. 265-270 ISBN 0786422173
- ↑ Leip, David. "Dave Leip's Atlas of U.S. Presidential Elections". uselectionatlas.org. Retrieved 2018-03-14.
External links
![]()

- Official website
Places adjacent to Brunswick County, North Carolina | ||||||||||
|---|---|---|---|---|---|---|---|---|---|---|
| ||||||||||
Municipalities and communities of Brunswick County, North Carolina, United States | ||
|---|---|---|
| Cities | 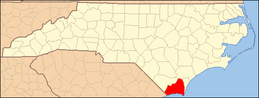 | |
| Towns | ||
| Village | ||
| Townships |
| |
| Unincorporated communities | ||