Red Lake County, Minnesota
| Red Lake County, Minnesota | |
|---|---|
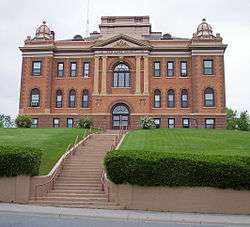 The Red Lake County Courthouse in Red Lake Falls in 2007 | |
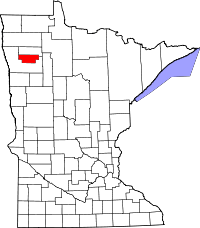 Location in the U.S. state of Minnesota | |
 Minnesota's location in the U.S. | |
| Founded | December 24, 1896[1] |
| Named for | Red Lake and Red Lake River |
| Seat | Red Lake Falls |
| Largest city | Red Lake Falls |
| Area | |
| • Total | 432 sq mi (1,119 km2) |
| • Land | 432 sq mi (1,119 km2) |
| • Water | 0.09 sq mi (0 km2), 0.02% |
| Population (est.) | |
| • (2016) | 4,007 |
| • Density | 9.5/sq mi (3.7/km2) |
| Congressional district | 7th |
| Time zone | Central: UTC−6/−5 |
| Website |
www |

Red Lake County is a county located in the U.S. state of Minnesota. As of the 2010 census, the population was 4,089,[3] making it the third-least populous county in Minnesota. Its county seat is Red Lake Falls.[4]
History
Red Lake County was formed on December 24, 1896 from sections of Polk County. It was named after the Red Lake River.[5]
The county has two sites on the National Register of Historic Places: the courthouse and Clearwater Evangelical Lutheran Church.
Geography
According to the U.S. Census Bureau, the county has a total area of 432 square miles (1,120 km2), of which 432 square miles (1,120 km2) is land and 0.09 square miles (0.23 km2) (0.02%) is water.[6]
Despite its name, Red Lake County contains only one named lake: Moran Lake, near Huot.[7]
Red Lake County is the only landlocked county in the United States (excluding those on international borders) to border exactly two other counties.[8]
Major highways


- Red Lake County 1: Connects the cities of Red Lake Falls and Plummer.
- Red Lake County 11: Connects the cities of Red Lake Falls with the community of Gentilly and the Crookston US-2 Truck Bypass.
Adjacent counties
- Pennington County (north)
- Polk County (south)
Demographics
| Historical population | |||
|---|---|---|---|
| Census | Pop. | %± | |
| 1900 | 12,195 | — | |
| 1910 | 6,564 | −46.2% | |
| 1920 | 7,263 | 10.6% | |
| 1930 | 6,887 | −5.2% | |
| 1940 | 7,413 | 7.6% | |
| 1950 | 6,806 | −8.2% | |
| 1960 | 5,830 | −14.3% | |
| 1970 | 5,388 | −7.6% | |
| 1980 | 5,471 | 1.5% | |
| 1990 | 4,525 | −17.3% | |
| 2000 | 4,299 | −5.0% | |
| 2010 | 4,089 | −4.9% | |
| Est. 2016 | 4,007 | [9] | −2.0% |
| U.S. Decennial Census[10] 1790-1960[11] 1900-1990[12] 1990-2000[13] 2010-2016[3] | |||
As of the 2000 census,[14] there were 4,299 people, 1,727 households, and 1,131 families residing in the county. The population density was 10 people per square mile (4/km²). There were 1,883 housing units at an average density of 4 per square mile (2/km²). The racial makeup of the county was 97.44% White, 0.19% Black or African American, 1.84% Native American, 0.07% Asian, 0.12% from other races, and 0.35% from two or more races. 0.30% of the population were Hispanic or Latino of any race. 31.9% were of Norwegian, 25.0% German, 16.7% French and 6.3% French Canadian ancestry.
There were 1,727 households out of which 30.70% had children under the age of 18 living with them, 55.40% were married couples living together, 6.80% had a female householder with no husband present, and 34.50% were non-families. 30.50% of all households were made up of individuals and 15.50% had someone living alone who was 65 years of age or older. The average household size was 2.39 and the average family size was 3.02.
In the county, the population was spread out with 25.50% under the age of 18, 7.50% from 18 to 24, 24.70% from 25 to 44, 23.20% from 45 to 64, and 19.10% who were 65 years of age or older. The median age was 40 years. For every 100 females there were 100.80 males. For every 100 females age 18 and over, there were 99.90 males.
The median income for a household in the county was $32,052, and the median income for a family was $40,275. Males had a median income of $28,494 versus $20,363 for females. The per capita income for the county was $15,372. About 8.40% of families and 10.80% of the population were below the poverty line, including 11.50% of those under age 18 and 13.10% of those age 65 or over.
Communities
Cities
- Brooks
- Oklee
- Plummer
- Red Lake Falls (county seat)
Townships
Unincorporated communities
Politics
Red Lake County was formerly solidly Democratic, voting for that party’s presidential nominee in all elections from 1928 until 1996, although since 2000 it has generally voted Republican, with the exception of its support for Barack Obama in 2008.
| Year | Republican | Democratic | Third parties |
|---|---|---|---|
| 2016 | 60.7% 1,141 | 28.7% 540 | 10.6% 200 |
| 2012 | 49.5% 978 | 47.0% 928 | 3.5% 69 |
| 2008 | 44.9% 983 | 51.1% 1,120 | 4.0% 88 |
| 2004 | 53.5% 1,164 | 44.2% 963 | 2.3% 50 |
| 2000 | 52.2% 1,090 | 39.7% 830 | 8.1% 170 |
| 1996 | 33.0% 695 | 50.0% 1,053 | 17.0% 358 |
| 1992 | 31.4% 691 | 46.3% 1,020 | 22.3% 490 |
| 1988 | 42.2% 918 | 56.5% 1,229 | 1.3% 28 |
| 1984 | 47.5% 1,184 | 51.9% 1,294 | 0.6% 15 |
| 1980 | 45.2% 1,223 | 48.7% 1,318 | 6.1% 166 |
| 1976 | 28.4% 737 | 67.2% 1,748 | 4.4% 115 |
| 1972 | 41.4% 1,052 | 55.5% 1,409 | 3.2% 80 |
| 1968 | 31.0% 718 | 63.3% 1,467 | 5.7% 133 |
| 1964 | 23.4% 573 | 76.0% 1,861 | 0.7% 16 |
| 1960 | 26.6% 679 | 73.2% 1,865 | 0.2% 5 |
| 1956 | 33.4% 782 | 66.3% 1,555 | 0.3% 8 |
| 1952 | 41.5% 1,034 | 57.5% 1,431 | 1.0% 26 |
| 1948 | 24.0% 592 | 71.8% 1,771 | 4.3% 105 |
| 1944 | 31.4% 757 | 68.0% 1,642 | 0.6% 15 |
| 1940 | 30.1% 876 | 69.4% 2,023 | 0.6% 16 |
| 1936 | 18.4% 487 | 77.5% 2,057 | 4.1% 109 |
| 1932 | 15.0% 351 | 80.9% 1,893 | 4.1% 97 |
| 1928 | 31.6% 712 | 66.8% 1,507 | 1.6% 37 |
| 1924 | 35.2% 643 | 11.7% 213 | 53.2% 971 |
| 1920 | 62.4% 1,308 | 26.6% 558 | 11.0% 231 |
| 1916 | 37.7% 463 | 56.5% 694 | 5.8% 71 |
| 1912 | 27.9% 259 | 40.3% 374 | 31.9% 296 |
| 1908 | 53.0% 1,428 | 31.8% 856 | 15.2% 410 |
| 1904 | 68.0% 1,430 | 19.0% 399 | 13.0% 274 |
| 1900 | 39.1% 823 | 55.3% 1,165 | 5.6% 117 |
See also
Footnotes
- ↑ "Minnesota Place Names". Minnesota Historical Society. Archived from the original on June 20, 2012. Retrieved March 19, 2014.
- ↑ Nelson, Steven (2011). Savanna Soils of Minnesota. Minnesota:Self. pp. 57-60. ISBN 978-0-615-50320-2.
- 1 2 "State & County QuickFacts". United States Census Bureau. Retrieved September 1, 2013.
- ↑ "Find a County". National Association of Counties. Retrieved 2011-06-07.
- ↑ Upham, Warren (1920). Minnesota Geographic Names: Their Origin and Historic Significance. Minnesota Historical Society. p. 445.
- ↑ "2010 Census Gazetteer Files". United States Census Bureau. August 22, 2012. Archived from the original on September 21, 2013. Retrieved October 24, 2014.
- ↑ "LakeFinder - Lake Search - Minnesota DNR - MN Department of Natural Resources". www.dnr.state.mn.us. Retrieved 2018-10-10.
- ↑ "Fewest County Borders – Part III: Red Lake Co., MN - Twelve Mile Circle". www.howderfamily.com. Retrieved 2018-10-10.
- ↑ "Population and Housing Unit Estimates". Retrieved June 9, 2017.
- ↑ "U.S. Decennial Census". United States Census Bureau. Retrieved October 24, 2014.
- ↑ "Historical Census Browser". University of Virginia Library. Retrieved October 24, 2014.
- ↑ "Population of Counties by Decennial Census: 1900 to 1990". United States Census Bureau. Retrieved October 24, 2014.
- ↑ "Census 2000 PHC-T-4. Ranking Tables for Counties: 1990 and 2000" (PDF). United States Census Bureau. Retrieved October 24, 2014.
- ↑ "American FactFinder". United States Census Bureau. Retrieved 2008-01-31.
- ↑ Leip, David. "Dave Leip's Atlas of U.S. Presidential Elections". uselectionatlas.org. Retrieved 2018-10-10.
Further reading
- Anne Healy and Sherry Kankel, A History of Red Lake County, Red Lake County, Minnesota. Red Lake Falls, MN?: Ray Miller, 2003.
- Christopher Ingraham, "I Called This Place 'America’s Worst Place to Live.' Then I Went There," Washington Post, Sept. 3, 2015.
- Oklee Golden Jubilee Historical Committee, The Oklee Community Story. n.c.: Oklee Golden Jubilee Historical Committee, 1960.
- Red Lake County Historical Society, A History of Red Lake County, Red Lake County, Minnesota. n.c.: Red Lake County Historical Society, 1976.
- Jeff M Sauve and Anne Healy, Courthouse Centennial, 1910-2010. n.c.: Red Lake County Historical Society, June 2010.
External links
- Red Lake County official website, www.co.red-lake.mn.us/
Places adjacent to Red Lake County, Minnesota | ||||||||||
|---|---|---|---|---|---|---|---|---|---|---|
| ||||||||||
Municipalities and communities of Red Lake County, Minnesota, United States | ||
|---|---|---|
| Cities | | |
| Townships | ||
| Unincorporated communities | ||
| Indian reservation | ||
| Footnotes | ‡This populated place also has portions in an adjacent county or counties | |