United States presidential election in Minnesota, 2000
|
| |||||||||||||||||||||||||||||||||
| |||||||||||||||||||||||||||||||||
| Turnout |
70.11%[1] | ||||||||||||||||||||||||||||||||
|---|---|---|---|---|---|---|---|---|---|---|---|---|---|---|---|---|---|---|---|---|---|---|---|---|---|---|---|---|---|---|---|---|---|
| |||||||||||||||||||||||||||||||||
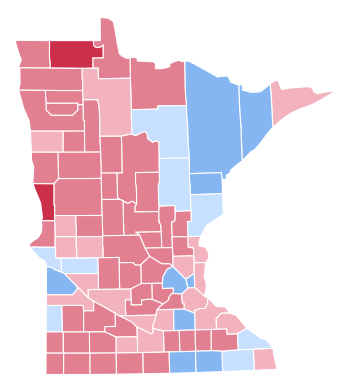 County Results
| |||||||||||||||||||||||||||||||||
| |||||||||||||||||||||||||||||||||
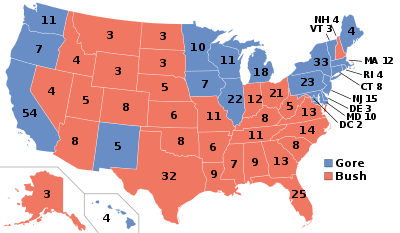
The 2000 United States presidential election in Minnesota took place on November 7, 2000, as part of the 2000 United States presidential election, which was held throughout all 50 states and D.C. Voters chose 10 representatives, or electors to the Electoral College, who voted for president and vice president.
Minnesota was won by Vice President Al Gore by a 2.4% margin of victory, a much weaker performance than President Bill Clinton had in 1996, when he carried the state with 51% of the vote and a 16% margin of victory. Despite winning the state, Gore lost most of the counties and congressional districts in the state. However Gore won highly populated counties such as Hennepin County, Ramsey County, and St. Louis County by safe margins. In terms of congressional districts, Gore won three districts including the urban 4th and 5th and won the 8th district with less than 50% of the vote. Bush overall dominated the rural areas, located in the western and southern parts of the state. No Republican has won the state since Richard Nixon in 1972, a Democratic streak longer than any other state. [2]
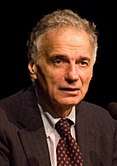
One reason the election was so close was that left-wing Green Party candidate Ralph Nader got over 5% of the vote.
Results
Despite Nader taking away a good deal of Gore voters, he was still able to win the state by a fairly close margin. Gore's win was partially due to his huge numbers out of Minneapolis, and St. Paul. Gore's win was able to keep Minnesota in Democrats hands once again. Minnesota has not gone for a Republican since 1972, when it went for then-president Richard M. Nixon. As of the 2016 presidential election, this is the last election in which Cook County voted for the Republican candidate.
| United States presidential election in Minnesota, 2000 | ||||||
|---|---|---|---|---|---|---|
| Party | Candidate | Running mate | Votes | Percentage | Electoral votes | |
| Democratic | Al Gore | Joe Lieberman | 1,168,266 | 47.91% | 10 | |
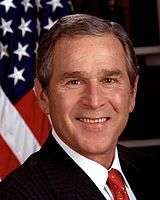
| Republican | George W. Bush | Dick Cheney | 1,109,659 | 45.50% | 0 | |
| Green | Ralph Nader | Winona LaDuke | 126,696 | 5.20% | 0 | |
| Reform | Pat Buchanan | Ezola Foster | 22,166 | 0.91% | 0 | |
| Libertarian | Harry Browne | Art Olivier | 5,282 | 0.22% | 0 | |
| Constitution | Howard Phillips | J. Curtis Frazier | 3,272 | 0.13% | 0 | |
| Natural Law | John Hagelin | A. Nat. Goldhaber | 2,294 | 0.09% | 0 | |
| Socialist Workers | James Harris | Margaret Trowe | 1,022 | 0.04% | 0 | |
| Write Ins | 28 | 0.00% | 0 | |||
| Totals | 2,438,685 | 100.00% | 10 | |||
| Voter turnout (Voting age/Registered) | 67%/75% | |||||
By county
| County | Gore% | Gore# | Bush% | Bush# | Others% | Others# | Total |
|---|---|---|---|---|---|---|---|
| Aitkin County | 44.98% | 3,830 | 44.10% | 3,755 | 10.91% | 929 | 8,514 |
| Anoka County | 46.22% | 68,008 | 47.07% | 69,256 | 6.71% | 9,869 | 147,133 |
| Becker County | 35.85% | 5,253 | 55.63% | 8,152 | 8.52% | 1,249 | 14,654 |
| Beltrami County | 41.73% | 7,301 | 47.71% | 8,346 | 10.56% | 1,848 | 17,495 |
| Benton County | 39.41% | 6,009 | 50.25% | 7,663 | 10.34% | 1,577 | 15,249 |
| Big Stone County | 46.92% | 1,430 | 44.95% | 1,370 | 8.14% | 248 | 3,048 |
| Blue Earth County | 44.45% | 12,329 | 46.66% | 12,942 | 8.9% | 2,468 | 27,739 |
| Brown County | 35.58% | 4,650 | 56.40% | 7,370 | 8.02% | 1,048 | 13,068 |
| Carlton County | 56.29% | 8,620 | 36.43% | 5,578 | 7.28% | 1,115 | 15,313 |
| Carver County | 35.23% | 12,462 | 58.78% | 20,790 | 5.99% | 2,120 | 35,372 |
| Cass County | 40.01% | 5,534 | 51.58% | 7,134 | 8.42% | 1,164 | 13,832 |
| Chippewa County | 45.45% | 2,952 | 45.84% | 2,977 | 8.71% | 566 | 6,495 |
| Chisago County | 43.02% | 9,593 | 49.04% | 10,937 | 7.94% | 1,770 | 22,300 |
| Clay County | 42.41% | 10,128 | 49.04% | 11,712 | 8.55% | 2,041 | 23,881 |
| Clearwater County | 37.56% | 1,466 | 54.75% | 2,137 | 7.69% | 300 | 3,903 |
| Cook County | 40.96% | 1,171 | 45.30% | 1,295 | 13.75% | 393 | 2,859 |
| Cottonwood County | 39.91% | 2,503 | 53.72% | 3,369 | 6.36% | 399 | 6,271 |
| Crow Wing County | 39.34% | 11,255 | 52.55% | 15,035 | 8.12% | 2,322 | 28,612 |
| Dakota County | 46.49% | 85,446 | 47.47% | 87,250 | 6.05% | 11,114 | 183,810 |
| Dodge County | 41.22% | 3,370 | 51.54% | 4,213 | 7.24% | 592 | 8,175 |
| Douglas County | 36.36% | 6,352 | 56.16% | 9,811 | 7.49% | 1,308 | 17,471 |
| Faribault County | 42.31% | 3,624 | 50.62% | 4,336 | 7.06% | 605 | 8,565 |
| Fillmore County | 48.44% | 5,020 | 44.83% | 4,646 | 6.73% | 698 | 10,364 |
| Freeborn County | 52.11% | 8,514 | 41.89% | 6,843 | 6.% | 980 | 16,337 |
| Goodhue County | 44.25% | 9,981 | 48.12% | 10,852 | 7.63% | 1,721 | 22,554 |
| Grant County | 40.53% | 1,507 | 48.52% | 1,804 | 10.95% | 407 | 3,718 |
| Hennepin County | 53.19% | 307,599 | 39.02% | 225,657 | 7.8% | 45,086 | 578,342 |
| Houston County | 43.61% | 4,502 | 49.18% | 5,077 | 7.22% | 745 | 10,324 |
| Hubbard County | 37.12% | 3,632 | 54.24% | 5,307 | 8.65% | 846 | 9,785 |
| Isanti County | 41.17% | 6,247 | 50.54% | 7,668 | 8.28% | 1,257 | 15,172 |
| Itasca County | 47.87% | 10,583 | 43.18% | 9,545 | 8.95% | 1,979 | 22,107 |
| Jackson County | 42.71% | 2,364 | 50.10% | 2,773 | 7.19% | 398 | 5,535 |
| Kanabec County | 40.70% | 2,831 | 50.03% | 3,480 | 9.27% | 645 | 6,956 |
| Kandiyohi County | 42.02% | 8,220 | 51.25% | 10,026 | 6.74% | 1,318 | 19,564 |
| Kittson County | 40.46% | 1,107 | 49.45% | 1,353 | 10.09% | 276 | 2,736 |
| Koochiching County | 41.35% | 2,903 | 50.19% | 3,523 | 8.46% | 594 | 7,020 |
| Lac qui Parle County | 49.28% | 2,244 | 42.62% | 1,941 | 8.1% | 369 | 4,554 |
| Lake County | 53.85% | 3,579 | 37.09% | 2,465 | 9.06% | 602 | 6,646 |
| Lake of the Woods County | 38.01% | 848 | 54.50% | 1,216 | 7.49% | 167 | 2,231 |
| Le Sueur County | 42.72% | 5,361 | 48.91% | 6,138 | 8.37% | 1,051 | 12,550 |
| Lincoln County | 47.51% | 1,590 | 45.20% | 1,513 | 7.29% | 244 | 3,347 |
| Lyon County | 40.60% | 4,737 | 52.17% | 6,087 | 7.23% | 843 | 11,667 |
| McLeod County | 35.76% | 5,609 | 55.98% | 8,782 | 8.26% | 1,296 | 15,687 |
| Mahnomen County | 39.92% | 921 | 48.63% | 1,122 | 11.44% | 264 | 2,307 |
| Marshall County | 35.37% | 1,910 | 53.93% | 2,912 | 10.7% | 578 | 5,400 |
| Martin County | 39.71% | 4,166 | 54.19% | 5,686 | 6.1% | 640 | 10,492 |
| Meeker County | 40.50% | 4,402 | 50.78% | 5,520 | 8.72% | 948 | 10,870 |
| Mille Lacs County | 41.90% | 4,376 | 50.01% | 5,223 | 8.09% | 845 | 10,444 |
| Morrison County | 34.65% | 5,274 | 53.85% | 8,197 | 11.5% | 1,751 | 15,222 |
| Mower County | 57.24% | 10,693 | 36.79% | 6,873 | 5.97% | 1,115 | 18,681 |
| Murray County | 43.23% | 2,093 | 49.71% | 2,407 | 7.06% | 342 | 4,842 |
| Nicollet County | 45.32% | 7,041 | 46.48% | 7,221 | 8.19% | 1,273 | 15,535 |
| Nobles County | 41.92% | 3,760 | 53.13% | 4,766 | 4.95% | 444 | 8,970 |
| Norman County | 41.79% | 1,575 | 47.97% | 1,808 | 10.24% | 386 | 3,769 |
| Olmsted County | 43.01% | 25,822 | 51.04% | 30,641 | 5.95% | 3,575 | 60,038 |
| Otter Tail County | 33.89% | 9,844 | 58.40% | 16,963 | 7.7% | 2,237 | 29,044 |
| Pennington County | 37.59% | 2,458 | 51.69% | 3,380 | 10.72% | 701 | 6,539 |
| Pine County | 45.96% | 6,148 | 43.76% | 5,854 | 10.28% | 1,375 | 13,377 |
| Pipestone County | 39.63% | 1,970 | 54.17% | 2,693 | 6.2% | 308 | 4,971 |
| Polk County | 39.70% | 5,764 | 52.40% | 7,609 | 7.9% | 1,147 | 14,520 |
| Pope County | 45.25% | 2,771 | 45.85% | 2,808 | 8.9% | 545 | 6,124 |
| Ramsey County | 56.16% | 138,470 | 35.56% | 87,669 | 8.28% | 20,415 | 246,554 |
| Red Lake County | 37.95% | 830 | 49.84% | 1,090 | 12.21% | 267 | 2,187 |
| Redwood County | 33.98% | 2,681 | 58.15% | 4,589 | 7.87% | 621 | 7,891 |
| Renville County | 42.52% | 3,533 | 48.57% | 4,036 | 8.91% | 740 | 8,309 |
| Rice County | 49.87% | 13,140 | 41.28% | 10,876 | 8.85% | 2,333 | 26,349 |
| Rock County | 41.33% | 2,081 | 55.05% | 2,772 | 3.61% | 182 | 5,035 |
| Roseau County | 29.04% | 2,128 | 64.07% | 4,695 | 6.89% | 505 | 7,328 |
| St. Louis County | 59.04% | 64,237 | 32.56% | 35,420 | 8.4% | 9,138 | 108,795 |
| Scott County | 39.55% | 17,503 | 54.13% | 23,954 | 6.32% | 2,797 | 44,254 |
| Sherburne County | 38.78% | 12,109 | 53.85% | 16,813 | 7.37% | 2,302 | 31,224 |
| Sibley County | 35.75% | 2,687 | 54.38% | 4,087 | 9.87% | 742 | 7,516 |
| Stearns County | 38.85% | 24,800 | 50.76% | 32,402 | 10.39% | 6,629 | 63,831 |
| Steele County | 42.36% | 6,900 | 50.48% | 8,223 | 7.16% | 1,167 | 16,290 |
| Stevens County | 41.66% | 2,434 | 48.46% | 2,831 | 9.88% | 577 | 5,842 |
| Swift County | 48.43% | 2,698 | 42.65% | 2,376 | 8.92% | 497 | 5,571 |
| Todd County | 35.87% | 4,132 | 52.36% | 6,031 | 11.76% | 1,355 | 11,518 |
| Traverse County | 40.83% | 884 | 49.61% | 1,074 | 9.56% | 207 | 2,165 |
| Wabasha County | 42.23% | 4,522 | 48.99% | 5,245 | 8.78% | 940 | 10,707 |
| Wadena County | 34.55% | 2,251 | 57.29% | 3,733 | 8.16% | 532 | 6,516 |
| Waseca County | 40.97% | 3,694 | 51.11% | 4,608 | 7.92% | 714 | 9,016 |
| Washington County | 46.01% | 49,637 | 47.74% | 51,502 | 6.24% | 6,736 | 107,875 |
| Watonwan County | 43.21% | 2,258 | 49.02% | 2,562 | 7.77% | 406 | 5,226 |
| Wilkin County | 30.33% | 1,046 | 58.92% | 2,032 | 10.76% | 371 | 3,449 |
| Winona County | 45.73% | 11,069 | 44.51% | 10,773 | 9.75% | 2,361 | 24,203 |
| Wright County | 38.08% | 16,762 | 54.21% | 23,861 | 7.71% | 3,394 | 44,017 |
| Yellow Medicine County | 44.72% | 2,528 | 45.96% | 2,598 | 9.32% | 527 | 5,653 |
Electors
Technically the voters of Minnesota cast their ballots for electors: representatives to the Electoral College. Minnesota is allocated 10 electors because it has 8 congressional districts and 2 senators. All candidates who appear on the ballot or qualify to receive write-in votes must submit a list of 10 electors, who pledge to vote for their candidate and his or her running mate. Whoever wins the majority of votes in the state is awarded all 10 electoral votes. Their chosen electors then vote for president and vice president. Although electors are pledged to their candidate and running mate, they are not obligated to vote for them. An elector who votes for someone other than his or her candidate is known as a faithless elector.
The electors of each state and the District of Columbia met on December 18, 2000[3] to cast their votes for president and vice president. The Electoral College itself never meets as one body. Instead the electors from each state and the District of Columbia met in their respective capitols.
The following were the members of the Electoral College from the state. All were pledged to and voted for Gore and Lieberman:[4]
- Carol Bartels
- Prudy Cameron
- Joan Campbell
- Elmer Deutschmann
- Elizabeth Kalisch
- Matthew Little
- Glenda Meixell
- John Meuers
- Janis Ray
- Georgiana Ruzich

