Watonwan County, Minnesota
| Watonwan County, Minnesota | |
|---|---|
 | |
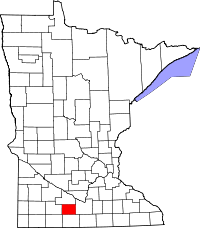 Location in the U.S. state of Minnesota | |
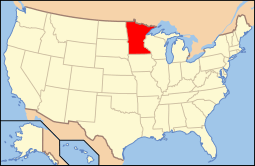 Minnesota's location in the U.S. | |
| Founded | February 25, 1860[1] |
| Named for | Dakota word "watanwan," meaning "fish bait," or "plenty of fish."[2] |
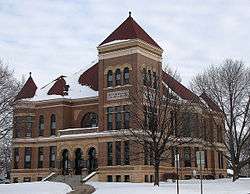
| Seat | St. James |
| Largest city | St. James |
| Area | |
| • Total | 440 sq mi (1,140 km2) |
| • Land | 435 sq mi (1,127 km2) |
| • Water | 4.8 sq mi (12 km2), 1.1% |
| Population (est.) | |
| • (2016) | 10,908 |
| • Density | 26/sq mi (10/km2) |
| Congressional district | 1st |
| Time zone | Central: UTC−6/−5 |
| Website |
www |
Watonwan County is a county located in the U.S. state of Minnesota. As of the 2010 census, the population was 11,211.[3] Its county seat is St. James.[4] The county was organized in 1860, two years after Minnesota was granted statehood.
Geography
According to the U.S. Census Bureau, the county has a total area of 440 square miles (1,100 km2), of which 435 square miles (1,130 km2) is land and 4.8 square miles (12 km2) (1.1%) is water.[5] The county is drained by the Watonwan River and its tributaries; the river flows eastwardly through the northern part of the county.[6]
Major highways
Lakes
- Bergdahl Lake: in Madelia Township
- Bullhead Lake: in Rosendale Township
- Butterfield Lake: in Butterfield Township
- Case Lake: in Fieldon Township
- Cottonwood Lake: in Adrian Township
- Ewy Lake: in Butterfield Township
- Fedji Lake: in Madelia Township
- Irish Lake: in Odin Township
- Long Lake: in Long Lake Township
- Mary Lake: in Long Lake Township
- Mud Lake: in Odin Township
- Kansas Lake: in Long Lake Township
- School Lake: in Odin Township
- St. James Lake: in St. James Township
- Sulem Lake: in Odin Township
- Wilson Lake: in Madelia Township (mistakenly referred to as School Lake by some records)
- Wood Lake: mostly in Adrian Township, but the northern fifth stretches into Brown County
Adjacent counties
- Brown County (north)
- Blue Earth County (east)
- Martin County (south)
- Jackson County (southwest)
- Cottonwood County (west)
Demographics
| Historical population | |||
|---|---|---|---|
| Census | Pop. | %± | |
| 1870 | 2,426 | — | |
| 1880 | 5,104 | 110.4% | |
| 1890 | 7,746 | 51.8% | |
| 1900 | 11,496 | 48.4% | |
| 1910 | 11,332 | −1.4% | |
| 1920 | 12,457 | 9.9% | |
| 1930 | 12,802 | 2.8% | |
| 1940 | 13,902 | 8.6% | |
| 1950 | 13,881 | −0.2% | |
| 1960 | 14,460 | 4.2% | |
| 1970 | 13,298 | −8.0% | |
| 1980 | 12,361 | −7.0% | |
| 1990 | 11,682 | −5.5% | |
| 2000 | 11,876 | 1.7% | |
| 2010 | 11,211 | −5.6% | |
| Est. 2016 | 10,908 | [8] | −2.7% |
| U.S. Decennial Census[9] 1790-1960[10] 1900-1990[11] 1990-2000[12] 2010-2016[3] | |||
As of the 2000 census,[13] there were 11,876 people, 4,627 households, and 3,141 families residing in the county. The population density was 27 people per square mile (11/km²). There were 5,036 housing units at an average density of 12 per square mile (4/km²). The racial makeup of the county was 88.54% White, 0.37% Black or African American, 0.21% Native American, 0.87% Asian, 0.02% Pacific Islander, 8.78% from other races, and 1.21% from two or more races. 15.19% of the population were Hispanic or Latino of any race. 40.9% were of German, 17.3% Norwegian and 5.8% Swedish ancestry.
There were 4,627 households out of which 32.50% had children under the age of 18 living with them, 56.60% were married couples living together, 7.30% had a female householder with no husband present, and 32.10% were non-families. 28.70% of all households were made up of individuals and 15.40% had someone living alone who was 65 years of age or older. The average household size was 2.53 and the average family size was 3.10.
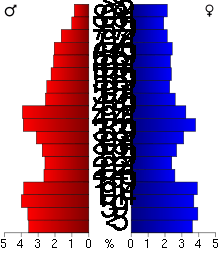
In the county, the population was spread out with 27.60% under the age of 18, 7.80% from 18 to 24, 24.30% from 25 to 44, 21.70% from 45 to 64, and 18.60% who were 65 years of age or older. The median age was 39 years. For every 100 females there were 95.40 males. For every 100 females age 18 and over, there were 94.50 males.
The median income for a household in the county was $35,441, and the median income for a family was $42,321. Males had a median income of $29,242 versus $19,788 for females. The per capita income for the county was $16,413. About 7.80% of families and 9.80% of the population were below the poverty line, including 13.50% of those under age 18 and 8.80% of those age 65 or over.
Communities
Cities
- Butterfield
- Darfur
- La Salle
- Lewisville
- Madelia
- Odin
- Ormsby (partly in Martin County)
- St. James (county seat)
Townships
Unincorporated communities
- Echols
- Godahl (partial)
- Grogan
- South Branch
- Sveadahl
- Tenmile Corner
Politics
| Year | Republican | Democratic | Third parties |
|---|---|---|---|
| 2016 | 55.4% 2,768 | 36.3% 1,814 | 8.3% 416 |
| 2012 | 48.9% 2,517 | 48.5% 2,494 | 2.6% 133 |
| 2008 | 48.0% 2,526 | 48.7% 2,562 | 3.2% 170 |
| 2004 | 53.2% 2,970 | 45.0% 2,514 | 1.8% 99 |
| 2000 | 49.9% 2,562 | 44.0% 2,258 | 6.1% 314 |
| 1996 | 37.7% 1,997 | 47.9% 2,534 | 14.4% 760 |
| 1992 | 33.5% 1,871 | 37.7% 2,100 | 28.8% 1,607 |
| 1988 | 52.1% 2,821 | 47.0% 2,544 | 0.9% 50 |
| 1984 | 59.0% 3,526 | 40.6% 2,425 | 0.5% 27 |
| 1980 | 55.1% 3,629 | 37.1% 2,442 | 7.8% 516 |
| 1976 | 50.3% 3,351 | 47.7% 3,177 | 2.0% 134 |
| 1972 | 63.4% 3,960 | 35.7% 2,229 | 1.0% 62 |
| 1968 | 53.6% 3,446 | 42.0% 2,701 | 4.4% 286 |
| 1964 | 43.8% 2,823 | 56.1% 3,615 | 0.1% 7 |
| 1960 | 63.3% 4,173 | 36.6% 2,412 | 0.2% 10 |
| 1956 | 67.6% 3,963 | 32.2% 1,886 | 0.2% 12 |
| 1952 | 72.0% 4,549 | 27.7% 1,752 | 0.2% 15 |
| 1948 | 45.3% 2,581 | 53.3% 3,039 | 1.4% 78 |
| 1944 | 57.3% 3,146 | 42.3% 2,324 | 0.4% 23 |
| 1940 | 55.3% 3,478 | 44.3% 2,783 | 0.5% 28 |
| 1936 | 33.4% 1,930 | 63.6% 3,668 | 3.0% 174 |
| 1932 | 39.6% 1,919 | 57.7% 2,795 | 2.7% 129 |
| 1928 | 69.7% 3,306 | 29.8% 1,412 | 0.6% 26 |
| 1924 | 53.6% 2,297 | 6.5% 279 | 39.9% 1,712 |
| 1920 | 81.4% 3,510 | 15.0% 647 | 3.6% 155 |
| 1916 | 59.9% 1,300 | 36.9% 801 | 3.1% 68 |
| 1912 | 12.2% 254 | 29.7% 618 | 58.0% 1,206 |
| 1908 | 70.4% 1,411 | 26.8% 537 | 2.8% 55 |
| 1904 | 80.0% 1,455 | 16.9% 307 | 3.2% 58 |
| 1900 | 71.9% 1,509 | 24.3% 509 | 3.8% 80 |
| 1896 | 72.0% 1,622 | 26.0% 586 | 2.0% 45 |
| 1892 | 62.7% 934 | 26.0% 388 | 11.3% 168 |
See also
Footnotes
- ↑ "Minnesota Place Names". Minnesota Historical Society. Retrieved March 19, 2014.
- ↑ Chicago and North Western Railway Company (1908). A History of the Origin of the Place Names Connected with the Chicago & North Western and Chicago, St. Paul, Minneapolis & Omaha Railways. p. 165.
- 1 2 "State & County QuickFacts". United States Census Bureau. Retrieved September 1, 2013.
- ↑ "Find a County". National Association of Counties. Retrieved 2011-06-07.
- ↑ "2010 Census Gazetteer Files". United States Census Bureau. August 22, 2012. Archived from the original on October 6, 2014. Retrieved October 25, 2014.
- ↑ Minnesota Atlas & Gazetteer. Yarmouth, Me.: DeLorme. 1994. pp. 21–22. ISBN 0-89933-222-6.
- ↑ Nelson, Steven (2011). Savanna Soils of Minnesota. Minnesota: Self. pp. 65 - 67. ISBN 978-0-615-50320-2.
- ↑ "Population and Housing Unit Estimates". Retrieved June 9, 2017.
- ↑ "U.S. Decennial Census". United States Census Bureau. Retrieved October 25, 2014.
- ↑ "Historical Census Browser". University of Virginia Library. Retrieved October 25, 2014.
- ↑ "Population of Counties by Decennial Census: 1900 to 1990". United States Census Bureau. Retrieved October 25, 2014.
- ↑ "Census 2000 PHC-T-4. Ranking Tables for Counties: 1990 and 2000" (PDF). United States Census Bureau. Retrieved October 25, 2014.
- ↑ "American FactFinder". United States Census Bureau. Retrieved 2008-01-31.
- ↑ Leip, David. "Dave Leip's Atlas of U.S. Presidential Elections". uselectionatlas.org. Retrieved 10 October 2018.
Further reading
- John A. Brown (ed.), History of Cottonwood and Watonwan counties, Minnesota: Their People, Industries, and Institutions: With Biographical Sketches of Representative Citizens and Genealogical Records of Many of the Old Families. In Two Volumes. Indianapolis, IN: B.F. Bowen and Company, 1916. Volume 1 | Volume 2
Places adjacent to Watonwan County, Minnesota | ||||||||||
|---|---|---|---|---|---|---|---|---|---|---|
| ||||||||||
Municipalities and communities of Watonwan County, Minnesota, United States | ||
|---|---|---|
| Cities | | |
| Townships | ||
| Unincorporated communities | ||
| Footnotes | ‡This populated place also has portions in an adjacent county or counties | |