Murray County, Minnesota
| Murray County, Minnesota | |
|---|---|
 Murray County Government Center in Slayton, Minnesota | |
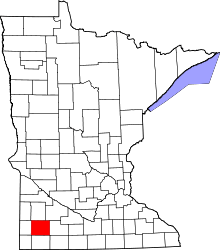 Location in the U.S. state of Minnesota | |
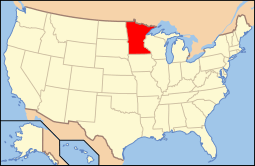 Minnesota's location in the U.S. | |
| Founded |
May 23, 1857 (created) 1872 (organized)[1] |
| Named for | William Pitt Murray, who served in various positions within government |
| Seat | Slayton |
| Largest city | Slayton |
| Area | |
| • Total | 720 sq mi (1,865 km2) |
| • Land | 705 sq mi (1,826 km2) |
| • Water | 15 sq mi (39 km2), 2.1% |
| Population (est.) | |
| • (2016) | 8,329 |
| • Density | 12/sq mi (5/km2) |
| Congressional district | 7th |
| Time zone | Central: UTC−6/−5 |
| Website |
www |
Murray County is a county located in the U.S. state of Minnesota. The population was 8,725 at the 2010 census.[2] Its county seat is Slayton.[3] The county was formed in 1857 and organized in 1872.
History
During the 1880s, there was a "war" to decide whether Currie or Slayton would be the county seat.[4]
In the history of record keeping, Minnesota has been struck by two F-5 tornadoes, and both occurred in Murray County: the Chandler-Lake Wilson Tornado (June 16, 1992) and the Tracy Tornado (June 13, 1968) that began in Murray County before crossing north into Lyon County.
Geography
According to the U.S. Census Bureau, the county has a total area of 720 square miles (1,900 km2), of which 705 square miles (1,830 km2) is land and 15 square miles (39 km2) (2.1%) is water.[5] The Mississippi-Missouri watershed divide runs through the western part of the county, near Chandler, along what is locally known as Buffalo Ridge. The highest point is in Chanarambie Township, over 1920 feet above sea level.[6]
Lakes
- Bear Lake (drained): in Lowville Township, Minnesota
- Bloody Lake: in Shetek Township
- Buffalo Lake: the extreme western edge of the lake is in Murray Township; most of the lake is in Dovray Township
- Corabelle Lake: in Iona Township
- Current Lake: western half is in Ellsborough Township; eastern half is in Skandia Township
- Fox Lake: in Shetek Township
- Fulda First Lake: in Bondin Township
- Iron Lake: in Skandia Township
- Julia Lake: mostly in Dovray Township; a small part of the lake extends eastward into Cottonwood County
- Lake Louisa: in Des Moines River Township
- Lake Maria: in Lake Sarah Township
- Lake Sarah: in Lake Sarah Township
- Lake Shetek: the northwest part is in Lake Sarah Township; the northeast part is in Shetek Township; the southeast part is in Murray Township; the southwest part is in Mason Township;
- Lake Wilson: in Leeds Township
- Lime Lake: in Lime Lake Township, formerly known as Lizzard Lake and Lake St. Rose[8]
- Long Lake: southern tip extends into Lake Sarah Township; mostly in Lyon County
- North Badger Lake: in Iona Township
- Round Lake: in Shetek Township
- Smith Lake: in Murray Township
- South Badger Lake: in Iona Township
- Summit Lake: in Leeds Township
- Talcot Lake: small part of the western part of the lake is in Belfast Township; it is mostly in Cottonwood County
Major highways
Adjacent counties
- Lyon County (north)
- Redwood County (northeast)
- Cottonwood County (east)
- Nobles County (south)
- Rock County (southwest)
- Pipestone County (west)
Demographics
| Historical population | |||
|---|---|---|---|
| Census | Pop. | %± | |
| 1860 | 29 | — | |
| 1870 | 209 | 620.7% | |
| 1880 | 3,604 | 1,624.4% | |
| 1890 | 6,692 | 85.7% | |
| 1900 | 11,911 | 78.0% | |
| 1910 | 11,755 | −1.3% | |
| 1920 | 13,631 | 16.0% | |
| 1930 | 13,902 | 2.0% | |
| 1940 | 15,060 | 8.3% | |
| 1950 | 14,801 | −1.7% | |
| 1960 | 14,743 | −0.4% | |
| 1970 | 12,508 | −15.2% | |
| 1980 | 11,507 | −8.0% | |
| 1990 | 9,660 | −16.1% | |
| 2000 | 9,165 | −5.1% | |
| 2010 | 8,725 | −4.8% | |
| Est. 2016 | 8,329 | [9] | −4.5% |
| U.S. Decennial Census[10] 1790-1960[11] 1900-1990[12] 1990-2000[13] 2010-2016[2] | |||

As of the 2000 census,[14] there were 9,165 people, 3,722 households, and 2,601 families residing in the county. The population density was 13 people per square mile (5/km²). There were 4,357 housing units at an average density of 6 per square mile (2/km²). The racial makeup of the county was 98.34% White, 0.10% Black or African American, 0.22% Native American, 0.21% Asian, 0.02% Pacific Islander, 0.45% from other races, and 0.67% from two or more races. 1.47% of the population were Hispanic or Latino of any race. 47.3% were of German, 12.9% Norwegian, 12.5% Dutch and 5.1% Swedish ancestry.
There were 3,722 households out of which 29.00% had children under the age of 18 living with them, 62.50% were married couples living together, 4.60% had a female householder with no husband present, and 30.10% were non-families. 27.10% of all households were made up of individuals and 15.30% had someone living alone who was 65 years of age or older. The average household size was 2.42 and the average family size was 2.94.
In the county, the population was spread out with 25.00% under the age of 18, 5.90% from 18 to 24, 23.30% from 25 to 44, 24.70% from 45 to 64, and 21.20% who were 65 years of age or older. The median age was 42 years. For every 100 females there were 98.50 males. For every 100 females age 18 and over, there were 97.00 males.
The median income for a household in the county was $34,966, and the median income for a family was $40,893. Males had a median income of $27,101 versus $19,636 for females. The per capita income for the county was $17,936. About 6.30% of families and 8.30% of the population were below the poverty line, including 8.40% of those under age 18 and 9.40% of those age 65 or over.
Communities
Cities
Townships
- Belfast Township
- Bondin Township
- Cameron Township
- Chanarambie Township
- Des Moines River Township
- Dovray Township
- Ellsborough Township
- Fenton Township
- Holly Township
- Iona Township
- Lake Sarah Township
- Leeds Township
- Lime Lake Township
- Lowville Township
- Mason Township
- Moulton Township
- Murray Township
- Shetek Township
- Skandia Township
- Slayton Township
Census-designated place
Unincorporated communities
Politics
| Year | Republican | Democratic | Third parties |
|---|---|---|---|
| 2016 | 63.7% 2,974 | 27.7% 1,295 | 8.6% 399 |
| 2012 | 52.5% 2,504 | 45.3% 2,160 | 2.2% 103 |
| 2008 | 48.2% 2,320 | 48.7% 2,345 | 3.1% 148 |
| 2004 | 54.4% 2,719 | 44.4% 2,218 | 1.2% 61 |
| 2000 | 50.6% 2,407 | 44.0% 2,093 | 5.3% 253 |
| 1996 | 39.2% 1,907 | 44.6% 2,173 | 16.2% 789 |
| 1992 | 30.9% 1,609 | 38.2% 1,993 | 30.9% 1,611 |
| 1988 | 44.4% 2,316 | 54.5% 2,840 | 1.1% 56 |
| 1984 | 49.9% 2,780 | 49.2% 2,741 | 1.0% 54 |
| 1980 | 48.6% 3,004 | 43.9% 2,714 | 7.6% 468 |
| 1976 | 40.7% 2,605 | 57.6% 3,685 | 1.7% 109 |
| 1972 | 49.9% 2,959 | 48.8% 2,893 | 1.3% 75 |
| 1968 | 49.4% 2,906 | 45.2% 2,662 | 5.4% 320 |
| 1964 | 37.8% 2,325 | 62.1% 3,822 | 0.1% 5 |
| 1960 | 52.6% 3,357 | 47.2% 3,009 | 0.2% 11 |
| 1956 | 54.6% 3,261 | 45.1% 2,695 | 0.3% 15 |
| 1952 | 65.2% 4,054 | 34.5% 2,145 | 0.4% 24 |
| 1948 | 34.8% 1,951 | 64.2% 3,594 | 1.0% 57 |
| 1944 | 50.7% 2,585 | 48.9% 2,495 | 0.4% 22 |
| 1940 | 48.5% 3,044 | 51.0% 3,203 | 0.5% 34 |
| 1936 | 27.3% 1,601 | 67.1% 3,926 | 5.6% 328 |
| 1932 | 28.2% 1,314 | 70.1% 3,264 | 1.7% 80 |
| 1928 | 55.3% 2,602 | 44.1% 2,078 | 0.6% 29 |
| 1924 | 45.8% 2,034 | 7.5% 334 | 46.7% 2,073 |
| 1920 | 79.2% 3,270 | 16.9% 698 | 4.0% 163 |
| 1916 | 46.6% 1,137 | 48.9% 1,193 | 4.4% 108 |
| 1912 | 17.2% 388 | 34.3% 775 | 48.5% 1,095 |
| 1908 | 60.3% 1,293 | 35.5% 762 | 4.2% 90 |
| 1904 | 70.9% 1,464 | 26.0% 537 | 3.2% 65 |
| 1900 | 60.7% 1,358 | 36.5% 816 | 2.9% 64 |
| 1896 | 52.3% 1,204 | 45.8% 1,054 | 2.0% 46 |
| 1892 | 36.9% 586 | 32.6% 517 | 30.5% 485 |
See also
References
- ↑ "Minnesota Place Names". Minnesota Historical Society. Retrieved March 18, 2014.
- 1 2 "State & County QuickFacts". United States Census Bureau. Archived from the original on July 15, 2011. Retrieved September 1, 2013.
- ↑ "Find a County". National Association of Counties. Retrieved 2011-06-07.
- ↑ Early W. Murray Co. MN Hist., pages 76-77, retrieved August 3, 2007
- ↑ "2010 Census Gazetteer Files". United States Census Bureau. August 22, 2012. Archived from the original on September 21, 2013. Retrieved October 21, 2014.
- ↑ "Buffalo Ridge, Minnesota". Retrieved 2013-06-24.
- ↑ Nelson, Steven (2011). Savanna Soils of Minnesota. Minnesota: Self. pp. 69-70. ISBN 978-0-615-50320-2.
- ↑ Murray County Minnesota - Lime Lake Archived 2007-09-28 at the Wayback Machine., retrieved August 3, 2007
- ↑ "Population and Housing Unit Estimates". Retrieved June 9, 2017.
- ↑ "U.S. Decennial Census". United States Census Bureau. Retrieved October 21, 2014.
- ↑ "Historical Census Browser". University of Virginia Library. Retrieved October 21, 2014.
- ↑ "Population of Counties by Decennial Census: 1900 to 1990". United States Census Bureau. Retrieved October 21, 2014.
- ↑ "Census 2000 PHC-T-4. Ranking Tables for Counties: 1990 and 2000" (PDF). United States Census Bureau. Retrieved October 21, 2014.
- ↑ "American FactFinder". United States Census Bureau. Retrieved 2008-01-31.
- ↑ Leip, David. "Dave Leip's Atlas of U.S. Presidential Elections". uselectionatlas.org. Retrieved 10 October 2018.
External links
Places adjacent to Murray County, Minnesota | ||||||||||
|---|---|---|---|---|---|---|---|---|---|---|
| ||||||||||
Municipalities and communities of Murray County, Minnesota, United States | ||
|---|---|---|
| Cities | | |
| Townships | ||
| CDP | ||
| Unincorporated communities | ||