Stevens County, Minnesota
| Stevens County, Minnesota | |
|---|---|
 | |
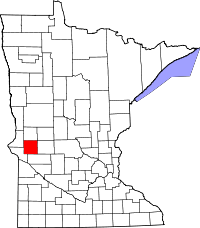 Location in the U.S. state of Minnesota | |
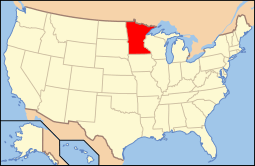 Minnesota's location in the U.S. | |
| Founded | February 20, 1862[1] |
| Named for | Isaac Ingalls Stevens |
| Seat | Morris |
| Largest city | Morris |
| Area | |
| • Total | 575 sq mi (1,489 km2) |
| • Land | 564 sq mi (1,461 km2) |
| • Water | 12 sq mi (31 km2), 2.0% |
| Population (est.) | |
| • (2016) | 9,693 |
| • Density | 17/sq mi (7/km2) |
| Congressional district | 7th |
| Time zone | Central: UTC−6/−5 |
| Website |
www |
Stevens County is a county located in the U.S. state of Minnesota. As of the 2010 census, the population was 9,726.[2] Its county seat is Morris.[3] The county was named for the Civil War Union general Isaac Stevens; it was named for him in 1862, seven years after a legislative clerical error denied him that honor in 1855 for what became Stearns County.[4]
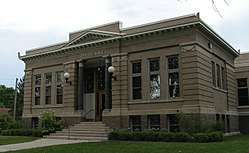
The county has the University of Minnesota Morris at the town of Morris. It was developed in the early twentieth century from the Morris Industrial School for Indians, which opened in the town in 1887 and was originally operated by the Roman Catholic Sisters of Mercy under contract to the federal government.
In 1975, a moderate earthquake occurred within the county.
Geography
According to the U.S. Census Bureau, the county has a total area of 575 square miles (1,490 km2), of which 564 square miles (1,460 km2) is land and 12 square miles (31 km2) (2.0%) is water.[5]
Major highways
Adjacent counties
- Grant County (north)
- Douglas County (northeast)
- Pope County (east)
- Swift County (south)
- Big Stone County (southwest)
- Traverse County (northwest)
Demographics
| Historical population | |||
|---|---|---|---|
| Census | Pop. | %± | |
| 1870 | 174 | — | |
| 1880 | 3,911 | 2,147.7% | |
| 1890 | 5,251 | 34.3% | |
| 1900 | 8,721 | 66.1% | |
| 1910 | 8,293 | −4.9% | |
| 1920 | 9,778 | 17.9% | |
| 1930 | 10,185 | 4.2% | |
| 1940 | 11,039 | 8.4% | |
| 1950 | 11,106 | 0.6% | |
| 1960 | 11,262 | 1.4% | |
| 1970 | 11,218 | −0.4% | |
| 1980 | 11,322 | 0.9% | |
| 1990 | 10,634 | −6.1% | |
| 2000 | 10,053 | −5.5% | |
| 2010 | 9,726 | −3.3% | |
| Est. 2016 | 9,693 | [7] | −0.3% |
| U.S. Decennial Census[8] 1790-1960[9] 1900-1990[10] 1990-2000[11] 2010-2016[2] | |||

As of the 2000 census,[12] there were 10,053 people, 3,751 households, and 2,366 families residing in the county. The population density was 18 people per square mile (7/km²). There were 4,074 housing units at an average density of 7 per square mile (3/km²). The racial makeup of the county was 96.13% White, 0.92% Black or African American, 0.70% Native American, 0.86% Asian, 0.02% Pacific Islander, 0.38% from other races, and 1.00% from two or more races. 0.90% of the population were Hispanic or Latino of any race. 44.8% were of German, 20.8% Norwegian and 5.4% Irish ancestry.
There were 3,751 households out of which 28.60% had children under the age of 18 living with them, 55.40% were married couples living together, 5.10% had a female householder with no husband present, and 36.90% were non-families. 29.10% of all households were made up of individuals and 14.20% had someone living alone who was 65 years of age or older. The average household size was 2.43 and the average family size was 2.99.
In the county, the population was spread out with 21.60% under the age of 18, 20.80% from 18 to 24, 21.60% from 25 to 44, 19.00% from 45 to 64, and 17.00% who were 65 years of age or older. The median age was 34 years. For every 100 females there were 93.90 males. For every 100 females age 18 and over, there were 91.00 males.
The median income for a household in the county was $37,267, and the median income for a family was $47,518. Males had a median income of $32,045 versus $21,681 for females. The per capita income for the county was $17,569. About 5.70% of families and 13.60% of the population were below the poverty line, including 6.50% of those under age 18 and 11.30% of those age 65 or over.
Communities
Cities
Townships
Politics
| Year | Republican | Democratic | Third parties |
|---|---|---|---|
| 2016 | 51.9% 2,799 | 39.2% 2,116 | 8.9% 483 |
| 2012 | 48.9% 2,766 | 48.5% 2,742 | 2.6% 144 |
| 2008 | 48.1% 2,710 | 49.4% 2,781 | 2.5% 143 |
| 2004 | 50.9% 3,030 | 47.4% 2,821 | 1.7% 98 |
| 2000 | 49.2% 2,831 | 42.3% 2,434 | 8.5% 487 |
| 1996 | 39.3% 2,141 | 50.3% 2,741 | 10.5% 573 |
| 1992 | 38.3% 2,229 | 42.4% 2,466 | 19.3% 1,121 |
| 1988 | 49.1% 2,679 | 49.9% 2,721 | 1.1% 58 |
| 1984 | 56.6% 3,251 | 42.7% 2,451 | 0.8% 44 |
| 1980 | 50.7% 3,283 | 39.5% 2,559 | 9.8% 634 |
| 1976 | 42.9% 2,484 | 54.8% 3,171 | 2.3% 134 |
| 1972 | 48.7% 2,830 | 49.4% 2,870 | 1.9% 111 |
| 1968 | 50.6% 2,560 | 44.4% 2,247 | 5.0% 255 |
| 1964 | 43.2% 2,220 | 56.7% 2,910 | 0.1% 7 |
| 1960 | 52.9% 2,710 | 46.9% 2,405 | 0.2% 11 |
| 1956 | 58.8% 2,606 | 41.1% 1,822 | 0.1% 2 |
| 1952 | 67.4% 3,288 | 32.4% 1,579 | 0.3% 12 |
| 1948 | 45.0% 1,928 | 54.0% 2,313 | 1.0% 42 |
| 1944 | 58.2% 2,377 | 41.5% 1,693 | 0.3% 12 |
| 1940 | 56.3% 2,619 | 43.4% 2,018 | 0.3% 15 |
| 1936 | 36.2% 1,431 | 59.4% 2,352 | 4.4% 175 |
| 1932 | 35.0% 1,396 | 64.0% 2,552 | 1.1% 42 |
| 1928 | 60.7% 2,275 | 38.9% 1,457 | 0.4% 16 |
| 1924 | 49.0% 1,553 | 7.5% 238 | 43.5% 1,379 |
| 1920 | 79.8% 2,339 | 15.6% 457 | 4.6% 134 |
| 1916 | 52.6% 943 | 43.9% 787 | 3.6% 64 |
| 1912 | 17.4% 286 | 38.9% 640 | 43.7% 718[14] |
| 1908 | 57.9% 877 | 38.4% 582 | 3.6% 55 |
| 1904 | 75.1% 1,254 | 21.7% 362 | 3.2% 53 |
| 1900 | 58.0% 1,036 | 38.2% 682 | 3.8% 68 |
| 1896 | 57.4% 981 | 40.1% 685 | 2.5% 43 |
| 1892 | 46.2% 622 | 37.8% 509 | 16.0% 215 |
See also
References
- ↑ "Minnesota Place Names". Minnesota Historical Society. Archived from the original on June 20, 2012. Retrieved March 19, 2014.
- 1 2 "State & County QuickFacts". United States Census Bureau. Retrieved September 1, 2013.
- ↑ "Find a County". National Association of Counties. Archived from the original on May 31, 2011. Retrieved 2011-06-07.
- ↑ Upham, Warren (1920). Minnesota Geographic Names: Their Origin and Historic Significance. Minnesota Historical Society. p. 535.
- ↑ "2010 Census Gazetteer Files". United States Census Bureau. August 22, 2012. Archived from the original on September 21, 2013. Retrieved October 25, 2014.
- ↑ Nelson, Steven (2011). Savanna Soils of Minnesota. Minnesota: Self. pp. 65 - 67. ISBN 978-0-615-50320-2.
- ↑ "Population and Housing Unit Estimates". Retrieved June 9, 2017.
- ↑ "U.S. Decennial Census". United States Census Bureau. Archived from the original on May 12, 2015. Retrieved October 25, 2014.
- ↑ "Historical Census Browser". University of Virginia Library. Retrieved October 25, 2014.
- ↑ "Population of Counties by Decennial Census: 1900 to 1990". United States Census Bureau. Retrieved October 25, 2014.
- ↑ "Census 2000 PHC-T-4. Ranking Tables for Counties: 1990 and 2000" (PDF). United States Census Bureau. Retrieved October 25, 2014.
- ↑ "American FactFinder". United States Census Bureau. Archived from the original on September 11, 2013. Retrieved 2008-01-31.
- ↑ Leip, David. "Dave Leip's Atlas of U.S. Presidential Elections". uselectionatlas.org. Retrieved 2018-10-10.
- ↑ The leading "other" candidate, Progressive Theodore Roosevelt, received 628 votes, while Prohibition candidate Eugene Chafin received 52 votes, Socialist candidate Eugene Debs received 33 votes, and Socialist Labor candidate Arthur Reimer received 5 votes.
External links
Places adjacent to Stevens County, Minnesota | ||||||||||
|---|---|---|---|---|---|---|---|---|---|---|
| ||||||||||
Municipalities and communities of Stevens County, Minnesota, United States | ||
|---|---|---|
| Cities | | |
| Townships | ||