Olmsted County, Minnesota
| Olmsted County, Minnesota | ||
|---|---|---|
 Olmsted County Government Center | ||
| ||
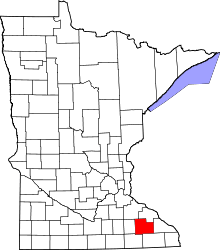 Location in the U.S. state of Minnesota | ||
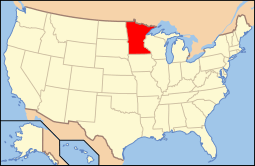 Minnesota's location in the U.S. | ||
| Founded | February 20, 1855[1] | |
| Named for | David Olmsted | |
| Seat | Rochester | |
| Largest city | Rochester | |
| Area | ||
| • Total | 655 sq mi (1,696 km2) | |
| • Land | 653 sq mi (1,691 km2) | |
| • Water | 1.5 sq mi (4 km2), 0.2% | |
| Population (est.) | ||
| • (2016) | 153,102 | |
| • Density | 221/sq mi (85/km2) | |
| Congressional district | 1st | |
| Time zone | Central: UTC−6/−5 | |
| Website |
www | |

Olmsted County is a county in the U.S. state of Minnesota. As of the 2010 census, the population was 144,248.[2] Its county seat and largest city is Rochester.[3] The county was founded in 1855 and named for David Olmsted, a member of the first territorial council and the first mayor of St. Paul.[4][5]
Olmsted County is part of the Rochester Metropolitan Statistical Area.
Geography
According to the U.S. Census Bureau, the county has a total area of 655 square miles (1,700 km2), of which 653 square miles (1,690 km2) is land and 1.5 square miles (3.9 km2) (0.2%) is water.[6]
It is one of four counties in Minnesota that does not have any natural lakes (the other three being Mower, Pipestone, and Rock).
Lakes
Though Olmsted County does not have any natural lakes, it does have six reservoirs created by dams.
- Chester Lake: Eyota Township
- Lake Florence: High Forest Township
- Lake George: Rochester Township
- Mayowood Lake: Rochester Township
- Silver Lake: Haverhill Township and Cascade Township
- Lake Zumbro (partially): Oronoco Township
Major highways
Adjacent counties
- Wabasha County (north)
- Winona County (east)
- Fillmore County (south)
- Mower County (southwest)
- Dodge County (west)
- Goodhue County (northwest)
Demographics
| Historical population | |||
|---|---|---|---|
| Census | Pop. | %± | |
| 1860 | 9,524 | — | |
| 1870 | 19,793 | 107.8% | |
| 1880 | 21,543 | 8.8% | |
| 1890 | 19,806 | −8.1% | |
| 1900 | 23,119 | 16.7% | |
| 1910 | 22,497 | −2.7% | |
| 1920 | 28,014 | 24.5% | |
| 1930 | 35,426 | 26.5% | |
| 1940 | 42,658 | 20.4% | |
| 1950 | 48,228 | 13.1% | |
| 1960 | 65,532 | 35.9% | |
| 1970 | 84,104 | 28.3% | |
| 1980 | 92,006 | 9.4% | |
| 1990 | 106,470 | 15.7% | |
| 2000 | 124,277 | 16.7% | |
| 2010 | 144,248 | 16.1% | |
| Est. 2016 | 153,102 | [8] | 6.1% |
| U.S. Decennial Census[9] 1790-1960[10] 1900-1990[11] 1990-2000[12] 2010-2016[2] | |||
As of the 2000 census, there were 124,277 people, 47,807 households, and 32,317 families residing in the county. The population density was 190 people per square mile (73/km²). There were 49,422 housing units at an average density of 76 per square mile (29/km²). The racial makeup of the county was 90.33% White, 2.68% Black or African American, 0.26% Native American, 4.27% Asian, 0.03% Pacific Islander, 0.92% from other races, and 1.51% from two or more races. 2.38% of the population were Hispanic or Latino of any race.
There were 47,807 households out of which 35.20% had children under the age of 18 living with them, 56.70% were married couples living together, 8.00% had a female householder with no husband present, and 32.40% were non-families. 25.80% of all households were made up of individuals and 7.60% had someone living alone who was 65 years of age or older. The average household size was 2.53 and the average family size was 3.09.
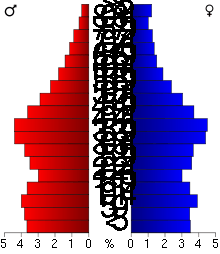
In the county, the population was spread out with 27.00% under the age of 18, 8.50% from 18 to 24, 32.20% from 25 to 44, 21.60% from 45 to 64, and 10.80% who were 65 years of age or older. The median age was 35 years. For every 100 females, there were 96.60 males. For every 100 females age 18 and over, there were 93.60 males.
The median income for a household in the county was $51,316, and the median income for a family was $61,610. Males had a median income of $40,196 versus $29,994 for females. The per capita income for the county was $24,939. About 3.80% of families and 6.40% of the population were below the poverty line, including 6.70% of those under age 18 and 9.50% of those age 65 or over.
Politics
Olmsted is a historically Republican county. Rapid population growth in Rochester, however, has been turning the county more competitive in the last several decades.
| Year | Republican | Democratic | Third parties |
|---|---|---|---|
| 2016 | 44.5% 35,668 | 45.3% 36,268 | 10.2% 8,193 |
| 2012 | 47.0% 36,832 | 50.2% 39,338 | 2.7% 2,146 |
| 2008 | 47.3% 36,202 | 50.6% 38,711 | 2.0% 1,557 |
| 2004 | 52.2% 37,371 | 46.5% 33,285 | 1.3% 919 |
| 2000 | 51.6% 30,641 | 43.5% 25,822 | 4.9% 2,929 |
| 1996 | 43.9% 22,860 | 43.9% 22,857 | 12.2% 6,327 |
| 1992 | 41.3% 23,404 | 33.6% 19,039 | 25.1% 14,219 |
| 1988 | 58.3% 27,683 | 40.9% 19,423 | 0.8% 398 |
| 1984 | 62.8% 28,129 | 36.4% 16,335 | 0.8% 359 |
| 1980 | 55.5% 22,704 | 34.2% 13,983 | 10.3% 4,224 |
| 1976 | 60.7% 24,030 | 37.0% 14,676 | 2.3% 911 |
| 1972 | 69.0% 23,806 | 28.4% 9,817 | 2.6% 898 |
| 1968 | 54.3% 17,292 | 42.1% 13,417 | 3.6% 1,131 |
| 1964 | 43.9% 12,699 | 55.9% 16,195 | 0.2% 56 |
| 1960 | 59.4% 16,080 | 40.3% 10,918 | 0.3% 67 |
| 1956 | 65.6% 13,789 | 34.1% 7,172 | 0.2% 51 |
| 1952 | 67.9% 14,566 | 31.7% 6,792 | 0.4% 89 |
| 1948 | 46.6% 8,131 | 52.4% 9,155 | 1.0% 181 |
| 1944 | 54.7% 8,355 | 45.0% 6,873 | 0.3% 46 |
| 1940 | 51.8% 9,096 | 47.8% 8,393 | 0.4% 62 |
| 1936 | 35.6% 5,316 | 60.0% 8,958 | 4.3% 645 |
| 1932 | 40.8% 5,254 | 57.0% 7,340 | 2.2% 280 |
| 1928 | 63.6% 8,334 | 36.0% 4,720 | 0.3% 44 |
| 1924 | 56.5% 5,722 | 8.5% 857 | 35.0% 3,548 |
| 1920 | 77.1% 7,130 | 19.0% 1,756 | 3.9% 359 |
| 1916 | 49.7% 2,101 | 45.5% 1,926 | 4.8% 203 |
| 1912 | 18.2% 720 | 39.0% 1,542 | 42.8% 1,691[14] |
| 1908 | 58.0% 2,472 | 38.1% 1,621 | 3.9% 167 |
| 1904 | 68.5% 2,745 | 28.5% 1,140 | 3.0% 120 |
| 1900 | 61.6% 2,818 | 34.9% 1,597 | 3.5% 158 |
| 1896 | 62.8% 3,201 | 34.2% 1,741 | 3.0% 153 |
| 1892 | 50.8% 2,344 | 41.8% 1,931 | 7.4% 340 |
Communities
Cities
- Byron
- Chatfield (partly in Fillmore County)
- Dover
- Eyota
- Oronoco
- Pine Island (partly in Goodhue County)
- Rochester (county seat)
- Stewartville
Townships
- Cascade Township
- Dover Township
- Elmira Township
- Eyota Township
- Farmington Township
- Haverhill Township
- High Forest Township
- Kalmar Township
- Marion Township
- New Haven Township
- Orion Township
- Oronoco Township
- Pleasant Grove Township
- Quincy Township
- Rochester Township
- Rock Dell Township
- Salem Township
- Viola Township
Unincorporated communities
See also
References
- ↑ "Minnesota Place Names". Minnesota Historical Society. Retrieved March 18, 2014.
- 1 2 "State & County QuickFacts". United States Census Bureau. Archived from the original on July 15, 2011. Retrieved September 1, 2013.
- ↑ "Find a County". National Association of Counties. Retrieved June 7, 2011.
- ↑ "History of Olmsted County". www.co.olmsted.mn.us. Retrieved October 10, 2018.
- ↑ "Minnesota Government Series, State Counties". Minnesota House of Representatives. Retrieved March 18, 2008.
- ↑ "2010 Census Gazetteer Files". United States Census Bureau. August 22, 2012. Archived from the original on September 21, 2013. Retrieved October 24, 2014.
- ↑ Nelson, Steven (2011). Savanna Soils of Minnesota. Minnesota: Self. pp. 43 - 48. ISBN 978-0-615-50320-2.
- ↑ "Population and Housing Unit Estimates". Retrieved June 9, 2017.
- ↑ "U.S. Decennial Census". United States Census Bureau. Retrieved October 24, 2014.
- ↑ "Historical Census Browser". University of Virginia Library. Retrieved October 24, 2014.
- ↑ "Population of Counties by Decennial Census: 1900 to 1990". United States Census Bureau. Retrieved October 24, 2014.
- ↑ "Census 2000 PHC-T-4. Ranking Tables for Counties: 1990 and 2000" (PDF). United States Census Bureau. Retrieved October 24, 2014.
- ↑ Leip, David. "Dave Leip's Atlas of U.S. Presidential Elections". uselectionatlas.org. Retrieved October 10, 2018.
- ↑ The leading "other" candidate, Progressive Theodore Roosevelt, received 1,467 votes, while Socialist candidate Eugene Debs received 112 votes, Prohibition candidate Eugene Chafin received 93 votes, and Socialist Labor candidate Arthur Reimer received 19 votes.
External links
| Wikisource has the text of the 1879 American Cyclopædia article Olmsted. |
Places adjacent to Olmsted County, Minnesota | ||||||||||
|---|---|---|---|---|---|---|---|---|---|---|
| ||||||||||
Municipalities and communities of Olmsted County, Minnesota, United States | ||
|---|---|---|
| Cities | | |
| Townships | ||
| Unincorporated communities | ||
| Footnotes | ‡This populated place also has portions in an adjacent county or counties | |