Kandiyohi County, Minnesota
| Kandiyohi County, Minnesota | |
|---|---|
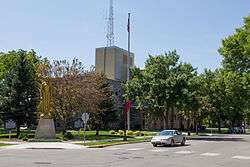 Kandiyohi County Courthouse | |
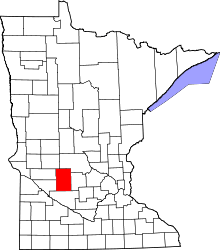 Location in the U.S. state of Minnesota | |
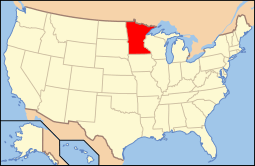 Minnesota's location in the U.S. | |
| Founded | March 20, 1858[1] |
| Named for | Dakota language for "where the buffalo fish come" |
| Seat | Willmar |
| Largest city | Willmar |
| Area | |
| • Total | 862 sq mi (2,233 km2) |
| • Land | 797 sq mi (2,064 km2) |
| • Water | 66 sq mi (171 km2), 7.6% |
| Population (est.) | |
| • (2016) | 42,495 |
| • Density | 53/sq mi (20/km2) |
| Congressional district | 7th |
| Time zone | Central: UTC−6/−5 |
| Website |
www |
Kandiyohi County (/kændiːˈjoʊhaɪ/ kan-dee-YOH-hy) is a county located in the U.S. state of Minnesota. As of the 2010 census, its population was 42,239.[2] Its county seat is Willmar.[3]
Kandiyohi County comprises the Willmar, MN Micropolitan Statistical Area.
History
Kandiyohi County is named after a Dakota word meaning "where the buffalo fish come"[4] (kandi’ - the buffalo fish + oh-hi’-yu - v. of hiyu - to come through).[5][6] Kandiyohi County was organized in 1858 with its county seat in Kandiyohi, which was then called Kandiyohi Station and was just a railroad stop. The original county occupied only the southern half of its current area. Development was slow, and in 1870 the state legislature called for Monongalia County to merge with Kandiyohi and make one larger county. It took until 21 November 1871 to agree on the centrally-located Willmar as the county seat.
Geography
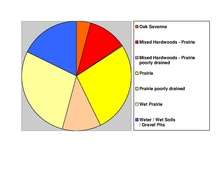
According to the U.S. Census Bureau, the county has a total area of 862 square miles (2,230 km2), of which 797 square miles (2,060 km2) are land and 66 square miles (170 km2) (7.6%) are covered by water.[7] Kandiyohi County is one of seven southern Minnesota counties that have no forest soils; only prairie ecosystems of savannas and prairies exist.

Lakes
- Bass Lake: western half is in Green Lake Township; eastern half is in Harrison Township
- Bear Lake: in New London Township
- Big Kandiyohi Lake: in Fahlun Township
- Burr Oak Lake: in Green Lake Township
- Calhoun Lake: in Irving Township
- Cherry Lake: in Lake Elizabeth Township
- Church Lake: in Mamre Township
- Crook Lake: in Lake Andrew Township
- Diamond Lake:
- Dog Lake: in East Lake Lillian Township
- Downs Lake: in Green Lake Township
- Eagle Lake: western half is in Dovre Township; eastern half is in Green Lake Township.
- East Solomon Lake: in Dovre Township
- East Sunburg Lake: in Arctander Township
- Elkhorn Lake: in Green Lake Township
- Ella Lake: in Gennessee Township
- Emma Lake: in East Lake Lillian Township
- Florida Lake: in Lake Andrew Township
- Foot Lake: in Willmar Township
- Games Lake: in Colfax Lake Township
- George Lake: mostly in New London Township, but the southern part stretches into Green Lake Township
- Ging Lake: in Green Lake Township
- Green Lake: the majority of it is mostly in New London Township, but the northeastern fifth is in Irving Township and the southern fifth is in Green Lake Township
- Hefta Lake: in Norway Lake Township
- Henchien Lake: in Lake Andrew Township
- Henderson Lake: in Green Lake Township
- Henium Lake: in Arctander Township
- Hubbard Lake: in Harrison Township
- Johnson Lake: in Lake Elizabeth Township
- Knutsons Lake: in Arctander Township
- Lake Andrew: in Lake Andrew Township
- Lake Carrie: in Gennessee Township
- Lake Eight: in New London Township
- Lake Eleanor: mostly in Kandiyohi Township, but the southern part extends into Fahlun Township
- Lake Elizabeth: the northern half is in Gennessee Township and the southern half is in Lake Elizabeth Township
- Lake Kasota: in Kandiyohi Township
- Lake Lillian: the eastern three fifths is in East Lake Lillian Township and the western two fifths is in Lake Lillian Township
- Lake Minnetaga: mostly in Gennessee Township, but the western part extends into Kandiyohi Township
- Lindgren Lake: in Mamre Township
- Little Kandiyohi Lake: the southern half is in Fahlun Township; the northern half is in Kandiyohi Township
- Long Lake: in Dovre Township
- Long Lake: there is another Long Lake- the southern half is in Irving Township and the northern half is in Roseville Township
- Mamre Lake: in Mamre Township
- Mary Lake: western half is in Arctander Township; eastern half is in Lake Andrew Township
- Middle Lake: in Lake Andrew Township
- Mud Lake: in Gennessee Township
- Nest Lake: in New London Township
- Norstedt Lake: in Lake Andrew Township
- Norway Lake: located in four different townships- Arctander, Lake Andrew, Norway Lake Township, and Colfax Township
- Olson Lake: in Edwards Township
- Otter Lake: in Lake Elizabeth Township
- Point Lake: in Dovre Township
- Prairie Lake: in Colfax Lake Township
- Ringo Lake: mostly in Dovre Township; a small eastern part is in Green Lake Township; a small northeastern part is in New London Township and a very small northwestern part of the lake extends into Lake Andrew Township
- Schultz Lake: in Harrison Township
- Shoemaker Lake: in Irving Township
- Skataas Lake: in Dovre Township
- Skull Lake: in Colfax Lake Township
- Sperry Lake: in Harrison Township
- Stevens lake: in Whitefield Township
- St. Johns Lake: southern three quarters is in St. Johns Township; northern quarter is in Mamre Township
- Summit Lake: in Gennessee Township
- Swan Lake: northern half is in Colfax Township and the southern half is in Lake Andrew Township
- Swan Lake: there is another Swan Lake, mostly in Dovre Township, but the southern part extends into Willmar Township
- Swan Lake: there is a third Swan Lake in Kandiyohi Township
- Swan Lake: there is a fourth Swan Lake in Mamre Township
- Swenson Lake: in Arctander Township
- Taits Lake: in Harrison Township
- Thompson Lake: in Green Lake Township
- Timber Lake: in Colfax Lake Township
- Twin Lakes: in Green Lake Township
- Wagonga Lake: about half of the lake is in Fahlun Township; the western third is in Whitefield Township; a small part of the lake extends into Kandiyohi Township
- West Solomon Lake: western half is in Mamre Township; eastern half is in Dovre Township
- West Sunburg Lake: mostly in Norway Lake Township but the southern part stretches into Arctander Township and the western part extends into Swift County
- Wheeler Lake: in Harrison Township
- Willmar Lake: in Willmar Township
- Woodcock Lake: in Green Lake Township
- Woodcock Lake: there is another Woodcock Lake, it is mostly in New London Township, but the southern part stretches into Green Lake Township
Major highways
Adjacent counties
- Stearns County (north)
- Meeker County (east)
- Renville County (south)
- Chippewa County (southwest)
- Swift County (west)
- Pope County (northwest)
Demographics
| Historical population | |||
|---|---|---|---|
| Census | Pop. | %± | |
| 1860 | 76 | — | |
| 1870 | 1,760 | 2,215.8% | |
| 1880 | 10,159 | 477.2% | |
| 1890 | 13,997 | 37.8% | |
| 1900 | 18,416 | 31.6% | |
| 1910 | 18,969 | 3.0% | |
| 1920 | 22,060 | 16.3% | |
| 1930 | 23,574 | 6.9% | |
| 1940 | 26,524 | 12.5% | |
| 1950 | 28,644 | 8.0% | |
| 1960 | 29,987 | 4.7% | |
| 1970 | 30,548 | 1.9% | |
| 1980 | 36,763 | 20.3% | |
| 1990 | 38,761 | 5.4% | |
| 2000 | 41,203 | 6.3% | |
| 2010 | 42,239 | 2.5% | |
| Est. 2016 | 42,495 | [9] | 0.6% |
| U.S. Decennial Census[10] 1790-1960[11] 1900-1990[12] 1990-2000[13] 2010-2016[2] | |||
As of the 2000 census, there were 41,203 people, 15,936 households, and 10,979 families residing in the county. The population density was 52 people per square mile (20/km²). There were 18,415 housing units at an average density of 23 per square mile (9/km²). The racial makeup of the county was 93.62% White, 0.51% Black or African American, 0.33% Native American, 0.38% Asian, 0.07% Pacific Islander, 4.17% from other races, and 0.91% from two or more races. 8.00% of the population were Hispanic or Latino of any race. 31.4% were of German, 25.8% Norwegian, 9.9% Swedish and 5.6% Dutch ancestry.
There were 15,936 households, out of which 33.10% had children under the age of 18 living with them, 57.70% were married couples living together, 7.50% had a female householder with no husband present, and 31.10% were non-families. 25.70% of all households were made up of individuals and 10.80% had someone living alone who was 65 years of age or older. The average household size was 2.53 and the average family size was 3.05.
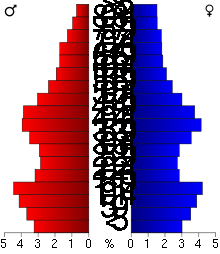
In the county, the population was spread out with 26.60% under the age of 18, 9.50% from 18 to 24, 26.50% from 25 to 44, 22.50% from 45 to 64, and 14.90% who were 65 years of age or older. The median age was 37 years. For every 100 females there were 98.00 males. For every 100 females age 18 and over, there were 94.90 males.
The median income for a household in the county was $39,772, and the median income for a family was $48,016. Males had a median income of $32,272 versus $22,128 for females. The per capita income for the county was $19,627. About 5.90% of families and 9.20% of the population were below the poverty line, including 11.10% of those under age 18 and 7.90% of those age 65 or over.
Communities
Cities
Townships
- Arctander Township
- Burbank Township
- Colfax Township
- Dovre Township
- East Lake Lillian Township
- Edwards Township
- Fahlun Township
- Gennessee Township
- Green Lake Township
- Harrison Township
- Holland Township
- Irving Township
- Kandiyohi Township
- Lake Andrew Township
- Lake Elizabeth Township
- Lake Lillian Township
- Mamre Township
- New London Township
- Norway Lake Township
- Roseland Township
- Roseville Township
- St. Johns Township
- Whitefield Township
- Willmar Township
Unincorporated communities
Politics
| Year | Republican | Democratic | Third parties |
|---|---|---|---|
| 2016 | 58.7% 12,785 | 33.4% 7,266 | 7.9% 1,721 |
| 2012 | 52.4% 11,240 | 45.7% 9,805 | 2.0% 420 |
| 2008 | 51.7% 11,319 | 46.2% 10,125 | 2.1% 451 |
| 2004 | 54.8% 11,704 | 43.7% 9,337 | 1.4% 308 |
| 2000 | 52.0% 10,026 | 42.6% 8,220 | 5.4% 1,039 |
| 1996 | 38.4% 7,119 | 48.6% 9,009 | 13.0% 2,404 |
| 1992 | 34.5% 6,784 | 40.3% 7,914 | 25.2% 4,958 |
| 1988 | 48.3% 8,634 | 50.2% 8,962 | 1.5% 266 |
| 1984 | 52.7% 9,539 | 46.4% 8,402 | 0.9% 163 |
| 1980 | 46.9% 8,480 | 44.4% 8,038 | 8.7% 1,577 |
| 1976 | 38.9% 6,664 | 58.3% 9,992 | 2.8% 474 |
| 1972 | 45.7% 6,624 | 50.0% 7,241 | 4.3% 616 |
| 1968 | 38.0% 5,086 | 57.0% 7,639 | 5.0% 675 |
| 1964 | 30.5% 4,011 | 69.2% 9,108 | 0.3% 37 |
| 1960 | 50.0% 6,786 | 49.7% 6,738 | 0.3% 43 |
| 1956 | 44.3% 5,445 | 55.5% 6,834 | 0.2% 26 |
| 1952 | 50.0% 6,370 | 49.1% 6,264 | 0.9% 113 |
| 1948 | 31.6% 3,666 | 62.1% 7,204 | 6.2% 723 |
| 1944 | 36.6% 3,784 | 62.6% 6,482 | 0.8% 87 |
| 1940 | 36.9% 4,263 | 62.3% 7,187 | 0.8% 90 |
| 1936 | 26.3% 2,500 | 69.3% 6,595 | 4.5% 429 |
| 1932 | 30.0% 2,674 | 65.3% 5,813 | 4.7% 414 |
| 1928 | 67.8% 5,780 | 29.1% 2,481 | 3.1% 261 |
| 1924 | 40.2% 3,222 | 2.8% 222 | 57.1% 4,578 |
| 1920 | 63.7% 4,759 | 17.2% 1,282 | 19.2% 1,433 |
| 1916 | 41.8% 1,612 | 51.1% 1,968 | 7.1% 275 |
| 1912 | 14.6% 484 | 25.8% 855 | 59.6% 1,979 |
| 1908 | 63.6% 2,312 | 26.1% 947 | 10.3% 375 |
| 1904 | 81.3% 2,576 | 8.0% 252 | 10.8% 342 |
| 1900 | 64.3% 2,343 | 33.1% 1,204 | 2.6% 96 |
| 1896 | 56.3% 2,181 | 42.3% 1,638 | 1.5% 58 |
| 1892 | 50.9% 1,341 | 14.9% 391 | 34.2% 901 |
See also
- Category:People from Willmar, Minnesota
- National Register of Historic Places listings in Kandiyohi County, Minnesota
References
- ↑ "Minnesota Place Names". Minnesota Historical Society. Retrieved March 18, 2014.
- 1 2 "State & County QuickFacts". United States Census Bureau. Archived from the original on July 12, 2011. Retrieved September 1, 2013.
- ↑ "Find a County". National Association of Counties. Archived from the original on 2011-05-31. Retrieved 2011-06-07.
- ↑ Gannett, Henry (1905). The Origin of Certain Place Names in the United States. Govt. Print. Off. p. 172.
- ↑ Riggs, Stephen (1890). Dakota-English Dictionary (1892 ed.). Minnesota Historical Society Press. Retrieved 11 July 2016.
- ↑ Bonde, Thomas J. H. (November 1996). "Buffalo Fish (the Real Thing) Is Special Acquisition" (PDF). The Minnesota History Interpreter. XXIV (11): 1. Retrieved 11 July 2016.
- ↑ "2010 Census Gazetteer Files". United States Census Bureau. August 22, 2012. Archived from the original on September 21, 2013. Retrieved October 18, 2014.
- ↑ Nelson, Steven (2011). Savanna Soils of Minnesota. Minnesota:Self. pp. 49-52. ISBN 978-0-615-50320-2.
- ↑ "Population and Housing Unit Estimates". Retrieved June 9, 2017.
- ↑ "U.S. Decennial Census". United States Census Bureau. Archived from the original on May 12, 2015. Retrieved October 18, 2014.
- ↑ "Historical Census Browser". University of Virginia Library. Retrieved October 18, 2014.
- ↑ "Population of Counties by Decennial Census: 1900 to 1990". United States Census Bureau. Retrieved October 18, 2014.
- ↑ "Census 2000 PHC-T-4. Ranking Tables for Counties: 1990 and 2000" (PDF). United States Census Bureau. Retrieved October 18, 2014.
- ↑ Leip, David. "Dave Leip's Atlas of U.S. Presidential Elections". uselectionatlas.org. Retrieved 7 April 2018.
External links
- Kandiyohi County & City of Willmar economic development Commission
- Kandiyohi County government’s website
- MNGenWebUSGenWeb website for Kandiyohi County, Minnesota
Places adjacent to Kandiyohi County, Minnesota | ||||||||||
|---|---|---|---|---|---|---|---|---|---|---|
| ||||||||||
Municipalities and communities of Kandiyohi County, Minnesota, United States | ||
|---|---|---|
| Cities | | |
| Townships | ||
| Unincorporated communities | ||