Big Stone County, Minnesota
| Big Stone County, Minnesota | |
|---|---|
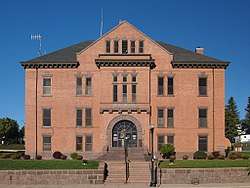 Big Stone County Courthouse in Ortonville, Minnesota. | |
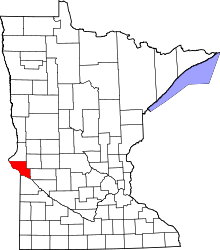 Location in the U.S. state of Minnesota | |
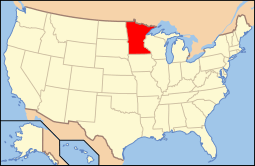 Minnesota's location in the U.S. | |
| Founded |
February 20, 1862 (created) 1874 (organized)[1] |
| Named for | Big Stone Lake |
| Seat | Ortonville |
| Largest city | Ortonville |
| Area | |
| • Total | 528 sq mi (1,368 km2) |
| • Land | 499 sq mi (1,292 km2) |
| • Water | 29 sq mi (75 km2), 5.5% |
| Population (est.) | |
| • (2016) | 5,050 |
| • Density | 11/sq mi (4/km2) |
| Congressional district | 7th |
| Time zone | Central: UTC−6/−5 |
| Website |
www |
Big Stone County is a county located in the U.S. state of Minnesota. As of the 2010 census, the population was 5,269.[2] Its county seat is Ortonville.[3]
History
The county was formed in 1862 and organized in 1874.[4]
Geography
According to the U.S. Census Bureau, the county has a total area of 528 square miles (1,370 km2), of which 499 square miles (1,290 km2) is land and 29 square miles (75 km2) (5.5%) is water.[5]
Lakes
- Artichoke Lake - south edge in Akron Township, vast majority in Artichoke Township
- Barry Lake - Toqua Township
- Bentsen Lake - east half in Otrey Township, west half in Big Stone Township
- Big Stone Lake - Ortonville Township, Browns Valley Township, Foster Township, Prior Township, Big Stone Township
- Clear Lake - Toqua Township
- Cup Lake - Almond Township
- Deep Lake - Big Stone Township
- East Toqua Lake - Graceville Township
- Eli Lake - south three-quarters in Almond Township, west quarter in Clinton
- Fogarty Lake - Toqua Township
- Horseshoe Lake - Odessa Township
- Lannon Lake - Graceville Township
- Lindgren Lake - Ortonville Township
- Lake Leo - Graceville Township
- Lone Tree Lake - east three-quarters in Malta Township, west quarter in Almond Township
- Long Lake - Artichoke Township
- Long Tom Lake - northeast edge in Otrey Township, vast majority in Odessa Township
- Lysing Lake - vast majority in Almond Township, south edge in Big Stone Township
- Marsh Lake - Akron Township
- Moonshine Lake - Moonshine Township
- Moulton Lake - Big Stone Township
- Mundweiler Lake - Big Stone Township
- Munnwyler Lake - Ortonville Township
- Olson Lake - Big Stone Township
- Olson Lake - Otrey Township
- Otrey Lake - Otrey Township
- Peterson Lake - Odessa Township
- South Rothwell Lake - north edge in Graceville Township, vast majority in Almond Township
- Smithwicks Lake - Graceville Township
- Swenson Lake - Big Stone Township
- Twin Lakes - Big Stone Township
- West Toqua Lake - Graceville Township
- Walter Lake - Ortonville Township
Source: United States Census Bureau 2007 TIGER/Line Shapefiles[7]
Major highways
Adjacent counties
- Traverse County, Minnesota (north)
- Stevens County, Minnesota (northeast)
- Swift County, Minnesota (southeast)
- Lac qui Parle County, Minnesota (south)
- Grant County, South Dakota (southwest)
- Roberts County, South Dakota (northwest)
National protected area
Climate and weather
| Ortonville, Minnesota | ||||||||||||||||||||||||||||||||||||||||||||||||||||||||||||
|---|---|---|---|---|---|---|---|---|---|---|---|---|---|---|---|---|---|---|---|---|---|---|---|---|---|---|---|---|---|---|---|---|---|---|---|---|---|---|---|---|---|---|---|---|---|---|---|---|---|---|---|---|---|---|---|---|---|---|---|---|
| Climate chart (explanation) | ||||||||||||||||||||||||||||||||||||||||||||||||||||||||||||
| ||||||||||||||||||||||||||||||||||||||||||||||||||||||||||||
| ||||||||||||||||||||||||||||||||||||||||||||||||||||||||||||
In recent years, average temperatures in the county seat of Ortonville have ranged from a low of 1 °F (−17 °C) in January to a high of 84 °F (29 °C) in July, although a record low of −44 °F (−42 °C) was recorded in February 1994 and a record high of 108 °F (42 °C) was recorded in July 1966. Average monthly precipitation ranged from 0.43 inches (11 mm) in December to 3.85 inches (98 mm) in July.[8]
Demographics
| Historical population | |||
|---|---|---|---|
| Census | Pop. | %± | |
| 1870 | 24 | — | |
| 1880 | 3,688 | 15,266.7% | |
| 1890 | 5,722 | 55.2% | |
| 1900 | 8,731 | 52.6% | |
| 1910 | 9,367 | 7.3% | |
| 1920 | 9,766 | 4.3% | |
| 1930 | 9,838 | 0.7% | |
| 1940 | 10,447 | 6.2% | |
| 1950 | 9,607 | −8.0% | |
| 1960 | 8,954 | −6.8% | |
| 1970 | 7,941 | −11.3% | |
| 1980 | 7,716 | −2.8% | |
| 1990 | 6,285 | −18.5% | |
| 2000 | 5,820 | −7.4% | |
| 2010 | 5,269 | −9.5% | |
| Est. 2016 | 5,050 | [9] | −4.2% |
| U.S. Decennial Census[10] 1790-1960[11] 1900-1990[12] 1990-2000[13] 2010-2016[2] | |||

As of the 2000 census,[14] there were 5,820 people, 2,377 households, and 1,611 families residing in the county. The population density was 12 people per square mile (5/km²). There were 3,171 housing units at an average density of 6 per square mile (2/km²). The racial makeup of the county was 98.44% White, 0.17% Black or African American, 0.52% Native American, 0.41% Asian, 0.12% from other races, and 0.34% from two or more races. 0.34% of the population were Hispanic or Latino of any race. 45.7% were of German, 21.0% Norwegian, 8.0% Swedish and 6.3% Irish ancestry.
There were 2,377 households out of which 29.00% had children under the age of 18 living with them, 59.60% were married couples living together, 5.30% had a female householder with no husband present, and 32.20% were non-families. 30.20% of all households were made up of individuals and 16.90% had someone living alone who was 65 years of age or older. The average household size was 2.38 and the average family size was 2.97.
In the county, the population was spread out with 24.80% under the age of 18, 5.30% from 18 to 24, 21.90% from 25 to 44, 24.00% from 45 to 64, and 24.00% who were 65 years of age or older. The median age was 44 years. For every 100 females there were 94.30 males. For every 100 females age 18 and over, there were 91.10 males.
The median income for a household in the county was $30,721, and the median income for a family was $37,354. Males had a median income of $27,857 versus $20,123 for females. The per capita income for the county was $15,708. About 7.80% of families and 12.00% of the population were below the poverty line, including 14.50% of those under age 18 and 8.80% of those age 65 or over.
Communities
Cities
Townships
Unincorporated communities
Politics
| Year | Republican | Democratic | Third parties |
|---|---|---|---|
| 2016 | 58.4% 1,608 | 33.4% 921 | 8.2% 226 |
| 2012 | 49.7% 1,385 | 48.2% 1,345 | 2.1% 59 |
| 2008 | 45.6% 1,362 | 51.9% 1,552 | 2.5% 76 |
| 2004 | 48.4% 1,483 | 50.1% 1,536 | 1.6% 48 |
| 2000 | 46.0% 1,370 | 48.0% 1,430 | 6.0% 180 |
| 1996 | 33.0% 990 | 54.0% 1,619 | 13.1% 392 |
| 1992 | 30.8% 1,052 | 47.1% 1,610 | 22.2% 758 |
| 1988 | 41.7% 1,469 | 57.5% 2,026 | 0.9% 31 |
| 1984 | 47.3% 1,821 | 51.8% 1,994 | 0.8% 32 |
| 1980 | 47.7% 1,950 | 44.3% 1,814 | 8.0% 327 |
| 1976 | 33.2% 1,332 | 64.4% 2,581 | 2.4% 94 |
| 1972 | 43.5% 1,748 | 54.4% 2,185 | 2.1% 84 |
| 1968 | 41.7% 1,645 | 53.7% 2,119 | 4.6% 182 |
| 1964 | 31.9% 1,331 | 67.9% 2,831 | 0.2% 10 |
| 1960 | 42.8% 1,834 | 56.9% 2,437 | 0.3% 11 |
| 1956 | 44.3% 1,737 | 55.5% 2,180 | 0.2% 8 |
| 1952 | 51.5% 2,260 | 48.0% 2,107 | 0.6% 25 |
| 1948 | 34.0% 1,321 | 63.5% 2,466 | 2.6% 99 |
| 1944 | 42.9% 1,608 | 56.5% 2,120 | 0.6% 24 |
| 1940 | 43.0% 1,925 | 56.2% 2,517 | 0.9% 40 |
| 1936 | 27.9% 1,116 | 66.2% 2,648 | 5.9% 235 |
| 1932 | 21.0% 868 | 77.4% 3,200 | 1.6% 68 |
| 1928 | 43.2% 1,641 | 56.2% 2,133 | 0.7% 25 |
| 1924 | 46.1% 1,524 | 7.9% 260 | 46.0% 1,519 |
| 1920 | 78.2% 2,415 | 14.6% 451 | 7.3% 224 |
| 1916 | 44.9% 810 | 48.1% 869 | 7.0% 126 |
| 1912 | 14.6% 244 | 40.4% 677 | 45.1% 755[16] |
| 1908 | 57.8% 965 | 33.8% 565 | 8.4% 140 |
| 1904 | 73.1% 1,234 | 18.8% 318 | 8.1% 136 |
| 1900 | 59.3% 1,081 | 35.3% 644 | 5.4% 99 |
| 1896 | 55.7% 1,048 | 39.5% 742 | 4.8% 91 |
| 1892 | 41.7% 576 | 36.0% 498 | 22.3% 308 |
See also
References
- ↑ "Minnesota Place Names". Minnesota Historical Society. Retrieved March 17, 2014.
- 1 2 "State & County QuickFacts". United States Census Bureau. Retrieved August 31, 2013.
- ↑ "Find a County". National Association of Counties. Archived from the original on May 31, 2011. Retrieved 2011-06-07.
- ↑ Upham, Warren (1920). Minnesota Geographic Names: Their Origin and Historic Significance. Minnesota Historical Society. p. 53.
- ↑ "2010 Census Gazetteer Files". United States Census Bureau. August 22, 2012. Archived from the original on October 6, 2014. Retrieved October 5, 2014.
- ↑ Nelson, Steven (2011). Savanna Soils of Minnesota. Minnesota: Self. pp. 65 - 67. ISBN 978-0-615-50320-2.
- ↑ "United States Census Bureau 2007 TIGER/Line Shapefiles". Archived from the original on 2007-03-10.
- 1 2 "Monthly Averages for Ortonville, Minnesota". The Weather Channel. Retrieved 2011-11-06.
- ↑ "Population and Housing Unit Estimates". Retrieved June 9, 2017.
- ↑ "U.S. Decennial Census". United States Census Bureau. Archived from the original on May 12, 2015. Retrieved October 5, 2014.
- ↑ "Historical Census Browser". University of Virginia Library. Retrieved October 5, 2014.
- ↑ "Population of Counties by Decennial Census: 1900 to 1990". United States Census Bureau. Retrieved October 5, 2014.
- ↑ "Census 2000 PHC-T-4. Ranking Tables for Counties: 1990 and 2000" (PDF). United States Census Bureau. Retrieved October 5, 2014.
- ↑ "American FactFinder". United States Census Bureau. Archived from the original on 2013-09-11. Retrieved 2008-01-31.
- ↑ Leip, David. "Dave Leip's Atlas of U.S. Presidential Elections". uselectionatlas.org. Retrieved 11 April 2018.
- ↑ The leading "other" candidate, Progressive Theodore Roosevelt, received 591 votes, while Socialist candidate Eugene Debs received 98 votes, Prohibition candidate Eugene Chafin received 62 votes, and Socialist Labor candidate Arthur Reimer received 4 votes.
External links
Places adjacent to Big Stone County, Minnesota | ||||||||||
|---|---|---|---|---|---|---|---|---|---|---|
| ||||||||||
Municipalities and communities of Big Stone County, Minnesota, United States | ||
|---|---|---|
| Cities | | |
| Townships | ||
| Unincorporated communities | ||
| Footnotes | ‡This populated place also has portions in an adjacent county or counties | |