Hubbard County, Minnesota
| Hubbard County, Minnesota | |
|---|---|
 The historic Hubbard County Courthouse in Park Rapids | |
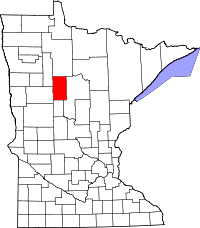 Location in the U.S. state of Minnesota | |
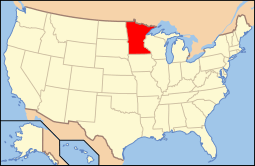 Minnesota's location in the U.S. | |
| Founded | February 26, 1883[1] |
| Named for | Lucius Frederick Hubbard |
| Seat | Park Rapids |
| Largest city | Park Rapids |
| Area | |
| • Total | 999.39 sq mi (2,588 km2) |
| • Land | 922.46 sq mi (2,389 km2) |
| • Water | 76.93 sq mi (199 km2), 7.70% |
| Population (est.) | |
| • (2016) | 20,718 |
| • Density | 20/sq mi (8/km2) |
| Congressional district | 8th |
| Time zone | Central: UTC−6/−5 |
| Website |
www |
Hubbard County is a county located in the U.S. state of Minnesota. As of the 2010 census, the population was 20,428.[2] Its county seat is Park Rapids.[3] The county is named for Lucius Frederick Hubbard, ninth Governor of Minnesota.[4]
A portion of the Leech Lake Indian Reservation is in the county.
Geography
According to the U.S. Census Bureau, the county has a total area of 1,000 square miles (2,600 km2), of which 926 square miles (2,400 km2) is land and 74 square miles (190 km2) (7.4%) is water.[5]
Major highways
Adjacent counties
- Beltrami County (north)
- Cass County (east)
- Wadena County (south)
- Becker County (southwest)
- Clearwater County (northwest)
Demographics
| Historical population | |||
|---|---|---|---|
| Census | Pop. | %± | |
| 1890 | 1,412 | — | |
| 1900 | 6,578 | 365.9% | |
| 1910 | 9,831 | 49.5% | |
| 1920 | 10,136 | 3.1% | |
| 1930 | 9,596 | −5.3% | |
| 1940 | 11,085 | 15.5% | |
| 1950 | 11,085 | 0.0% | |
| 1960 | 9,962 | −10.1% | |
| 1970 | 10,583 | 6.2% | |
| 1980 | 14,098 | 33.2% | |
| 1990 | 14,939 | 6.0% | |
| 2000 | 18,376 | 23.0% | |
| 2010 | 20,428 | 11.2% | |
| Est. 2016 | 20,718 | [7] | 1.4% |
| U.S. Decennial Census[8] 1790-1960[9] 1900-1990[10] 1990-2000[11] 2010-2016[2] | |||
As of the 2000 census,[12] there were 18,376 people, 7,435 households, and 5,345 families residing in the county. The population density was 20 people per square mile (8/km²). There were 12,229 housing units at an average density of 13 per square mile (5/km²). The racial makeup of the county was 96.31% White, 0.17% Black or African American, 2.13% Native American, 0.27% Asian, 0.01% Pacific Islander, 0.22% from other races, and 0.89% from two or more races. 0.67% of the population were Hispanic or Latino of any race. 35.0% were of German, 20.5% Norwegian, 6.0% English and 5.8% Swedish ancestry.
There were 7,435 households out of which 29.30% had children under the age of 18 living with them, 61.10% were married couples living together, 7.10% had a female householder with no husband present, and 28.10% were non-families. 24.20% of all households were made up of individuals and 11.30% had someone living alone who was 65 years of age or older. The average household size was 2.45 and the average family size was 2.88.

In the county, the population was spread out with 24.60% under the age of 18, 6.40% from 18 to 24, 24.10% from 25 to 44, 26.90% from 45 to 64, and 18.00% who were 65 years of age or older. The median age was 42 years. For every 100 females there were 99.90 males. For every 100 females age 18 and over, there were 98.00 males.
The median income for a household in the county was $35,321, and the median income for a family was $41,177. Males had a median income of $30,030 versus $21,616 for females. The per capita income for the county was $18,115. 9.70% of the population and 7.50% of families were below the poverty line. 12.50% of those under the age of 18 and 9.30% of those 65 and older were living below the poverty line.
Communities
Cities
Townships
- Akeley Township
- Arago Township
- Badoura Township
- Clay Township
- Clover Township
- Crow Wing Lake Township
- Farden Township
- Fern Township
- Guthrie Township
- Hart Lake Township
- Helga Township
- Hendrickson Township
- Henrietta Township
- Hubbard Township
- Lake Alice Township
- Lake Emma Township
- Lake George Township
- Lake Hattie Township
- Lakeport Township
- Mantrap Township
- Nevis Township
- Rockwood Township
- Schoolcraft Township
- Steamboat River Township
- Straight River Township
- Thorpe Township
- Todd Township
- White Oak Township
Census-designated place
Other unincorporated communities
Politics
| Year | Republican | Democratic | Third parties |
|---|---|---|---|
| 2016 | 63.1% 7,261 | 29.8% 3,423 | 7.1% 821 |
| 2012 | 57.5% 6,622 | 40.6% 4,676 | 1.9% 222 |
| 2008 | 56.4% 6,558 | 41.9% 4,872 | 1.8% 208 |
| 2004 | 56.8% 6,444 | 41.8% 4,741 | 1.4% 155 |
| 2000 | 55.2% 5,307 | 37.8% 3,632 | 7.0% 674 |
| 1996 | 41.3% 3,593 | 43.7% 3,802 | 15.1% 1,316 |
| 1992 | 37.6% 3,227 | 39.1% 3,362 | 23.3% 2,000 |
| 1988 | 56.4% 4,365 | 42.7% 3,306 | 0.8% 65 |
| 1984 | 61.8% 4,621 | 37.5% 2,806 | 0.7% 55 |
| 1980 | 55.5% 4,172 | 37.8% 2,840 | 6.7% 501 |
| 1976 | 46.0% 2,985 | 49.3% 3,196 | 4.8% 308 |
| 1972 | 59.3% 3,294 | 38.5% 2,136 | 2.2% 124 |
| 1968 | 55.0% 2,720 | 38.8% 1,920 | 6.3% 310 |
| 1964 | 47.1% 2,283 | 52.7% 2,553 | 0.1% 7 |
| 1960 | 57.4% 2,749 | 42.4% 2,029 | 0.2% 9 |
| 1956 | 62.7% 2,453 | 37.2% 1,454 | 0.2% 6 |
| 1952 | 69.0% 3,099 | 30.3% 1,360 | 0.8% 34 |
| 1948 | 48.8% 2,071 | 48.2% 2,044 | 3.0% 126 |
| 1944 | 56.5% 2,114 | 43.1% 1,613 | 0.4% 13 |
| 1940 | 54.0% 2,544 | 45.5% 2,141 | 0.6% 26 |
| 1936 | 39.8% 1,618 | 56.9% 2,312 | 3.3% 132 |
| 1932 | 36.0% 1,349 | 59.5% 2,230 | 4.6% 172 |
| 1928 | 65.8% 2,291 | 32.2% 1,120 | 2.1% 73 |
| 1924 | 57.8% 1,884 | 5.9% 191 | 36.3% 1,184 |
| 1920 | 73.8% 2,238 | 15.0% 453 | 11.2% 340 |
| 1916 | 40.4% 685 | 47.1% 799 | 12.5% 212 |
| 1912 | 21.2% 359 | 26.6% 450 | 52.2% 884 |
| 1908 | 69.1% 1,288 | 21.5% 401 | 9.4% 175 |
| 1904 | 80.0% 1,392 | 13.3% 232 | 6.7% 117 |
| 1900 | 66.1% 1,009 | 30.4% 464 | 3.5% 53 |
| 1896 | 49.7% 364 | 47.0% 344 | 3.3% 24 |
| 1892 | 35.7% 164 | 28.0% 129 | 36.3% 167 |
See also
References
- ↑ "Minnesota Place Names". Minnesota Historical Society. Retrieved March 18, 2014.
- 1 2 "State & County QuickFacts". United States Census Bureau. Archived from the original on July 11, 2011. Retrieved September 1, 2013.
- ↑ "Find a County". National Association of Counties. Archived from the original on 2011-05-31. Retrieved 2011-06-07.
- ↑ Gannett, Henry (1905). The Origin of Certain Place Names in the United States. Govt. Print. Off. p. 162.
- ↑ "2010 Census Gazetteer Files". United States Census Bureau. August 22, 2012. Archived from the original on October 6, 2014. Retrieved October 15, 2014.
- ↑ Nelson, Steven (2011). Savanna Soils of Minnesota. Minnesota: Self. pp. 53 - 56. ISBN 978-0-615-50320-2.
- ↑ "Population and Housing Unit Estimates". Retrieved June 9, 2017.
- ↑ "U.S. Decennial Census". United States Census Bureau. Archived from the original on May 12, 2015. Retrieved October 15, 2014.
- ↑ "Historical Census Browser". University of Virginia Library. Retrieved October 15, 2014.
- ↑ "Population of Counties by Decennial Census: 1900 to 1990". United States Census Bureau. Retrieved October 15, 2014.
- ↑ "Census 2000 PHC-T-4. Ranking Tables for Counties: 1990 and 2000" (PDF). United States Census Bureau. Retrieved October 15, 2014.
- ↑ "American FactFinder". United States Census Bureau. Retrieved 2008-01-31.
- ↑ Leip, David. "Dave Leip's Atlas of U.S. Presidential Elections". uselectionatlas.org. Retrieved 19 September 2018.
External links
- Hubbard County government’s website
- Hubbard County Historical Society
- Hubbard County Genealogical Society
Places adjacent to Hubbard County, Minnesota | ||||||||||
|---|---|---|---|---|---|---|---|---|---|---|
| ||||||||||
Municipalities and communities of Hubbard County, Minnesota, United States | ||
|---|---|---|
| Cities | | |
| Townships | ||
| CDP | ||
| Unincorporated communities | ||
| Indian reservation | ||
| Footnotes | ‡This populated place also has portions in an adjacent county or counties | |