Itasca County, Minnesota
| Itasca County, Minnesota | |
|---|---|
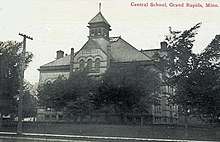 Postcard. Grand Rapids High School was founded in 1895. | |
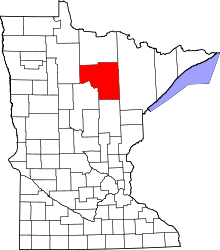 Location in the U.S. state of Minnesota | |
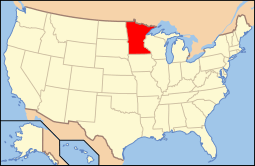 Minnesota's location in the U.S. | |
| Founded | October 27, 1849[1] |
| Named for | Two Latin words for "truth" and "head" |
| Seat | Grand Rapids |
| Largest city | Grand Rapids |
| Area | |
| • Total | 2,928 sq mi (7,583 km2) |
| • Land | 2,668 sq mi (6,910 km2) |
| • Water | 260 sq mi (673 km2), 8.9% |
| Population (est.) | |
| • (2016) | 45,242 |
| • Density | 17/sq mi (7/km2) |
| Congressional district | 8th |
| Time zone | Central: UTC−6/−5 |
| Website |
www |
Itasca County is a county located in the State of Minnesota. As of the 2010 census, the population was 45,058.[2] Its county seat is Grand Rapids.[3] The county is named after Lake Itasca, which is in turn a shortened version the Latin words veritas caput, meaning 'truth' and 'head', a reference to the source of the Mississippi River. Portions of the Bois Forte and Leech Lake Indian reservations are in the county.
History
Itasca County was first formed in 1849, upon the creation of the Minnesota Territory. It was originally a much larger county, which covered many of today's northeastern Minnesota counties. The original Itasca County stretched over Cook, Lake, Saint Louis, Koochiching, eastern Lake of the Woods, eastern Beltrami, Itasca, northern Aitkin, and northern Carlton counties, today in Minnesota.
Itasca County was originally named for Lake Itasca (no longer in the county). It was found to be the true source of the Mississippi River. After many disputes over finding the source of the Mississippi River, Henry Roe Schoolcraft set out to find its true source in 1832. Once he came upon its true source, he decided to name this 'Lake Itasca.' The Mississippi River flows from its small beginnings at Lake Itasca past Bemidji, through Itasca County and continues all the way down to the Gulf of Mexico.
Geography
According to the U.S. Census Bureau, the county has a total area of 2,928 square miles (7,580 km2), of which 2,668 square miles (6,910 km2) is land and 260 square miles (670 km2) (8.9%) is water.[4] It is the third-largest county in Minnesota by land area.
The landscape in Itasca County varies greatly. The low plains, rolling hills, and wetlands occur where there was glacial activity in the past. This area is known greatly for being forested, and has been for centuries. The different forests are made up of trees such as pines, spruces, hardwoods, cedar, and tamarack. The many large forests in the area make forestry and logging major sectors in the economy.
Major forests in the county include the Chippewa National Forest, the Big Fork State Forest, George Washington State Forest, Golden Anniversary State Forest, and the Marcell Experimental Forest.
In Itasca County there are many different bodies of water from big lakes, to small creeks, to major rivers. Over 1400 lakes are located within the county. These bodies of water help support many different wildlife species such as different birds and small mammals. Major bodies of water in the county include Lake Winnibigoshish, Pokegama Lake, Deer Lake, the Mississippi River, Bowstring Lake, and the Blandin Paper Mill Reservoir.
Major highways
Adjacent counties
- Koochiching County (north)
- Saint Louis County (east)
- Aitkin County (south)
- Cass County (southwest)
- Beltrami County (west)
National protected area
- Chippewa National Forest (part)
Demographics
| Historical population | |||
|---|---|---|---|
| Census | Pop. | %± | |
| 1850 | 97 | — | |
| 1860 | 51 | −47.4% | |
| 1870 | 96 | 88.2% | |
| 1880 | 124 | 29.2% | |
| 1890 | 743 | 499.2% | |
| 1900 | 4,573 | 515.5% | |
| 1910 | 17,208 | 276.3% | |
| 1920 | 23,876 | 38.7% | |
| 1930 | 27,224 | 14.0% | |
| 1940 | 32,996 | 21.2% | |
| 1950 | 33,321 | 1.0% | |
| 1960 | 38,006 | 14.1% | |
| 1970 | 35,530 | −6.5% | |
| 1980 | 43,069 | 21.2% | |
| 1990 | 40,863 | −5.1% | |
| 2000 | 43,992 | 7.7% | |
| 2010 | 45,058 | 2.4% | |
| Est. 2016 | 45,242 | [5] | 0.4% |
| U.S. Decennial Census[6] 1790-1960[7] 1900-1990[8] 1990-2000[9] 2010-2016[2] | |||

As of the 2000 census, there were 43,992 people, 17,789 households, and 12,381 families residing in the county. The population density was 16 people per square mile (6/km²). There were 24,528 housing units at an average density of 9 per square mile (4/km²). The racial makeup of the county was 94.64% White, 0.16% Black or African American, 3.40% Native American, 0.27% Asian, 0.02% Pacific Islander, 0.16% from other races, and 1.34% from two or more races. 0.60% of the population were Hispanic or Latino of any race. 25.6% were of German, 13.8% Norwegian, 7.7% Finnish, 7.2% Swedish, 6.2% Irish, 5.0% United States or American and 5.0% English ancestry.
There were 17,789 households out of which 29.20% had children under the age of 18 living with them, 58.30% were married couples living together, 7.60% had a female householder with no husband present, and 30.40% were non-families. 26.00% of all households were made up of individuals and 12.20% had someone living alone who was 65 years of age or older. The average household size was 2.43 and the average family size was 2.91.
In the county, the population was spread out with 24.40% under the age of 18, 7.60% from 18 to 24, 24.40% from 25 to 44, 26.70% from 45 to 64, and 16.80% who were 65 years of age or older. The median age was 41 years. For every 100 females there were 99.70 males. For every 100 females age 18 and over, there were 98.20 males.
The median income for a household in the county was $36,234, and the median income for a family was $44,025. Males had a median income of $37,066 versus $22,327 for females. The per capita income for the county was $17,717. About 7.70% of families and 10.60% of the population were below the poverty line, including 13.60% of those under age 18 and 8.80% of those age 65 or over.
Communities
Cities
Townships
- Alvwood Township
- Arbo Township
- Ardenhurst Township
- Balsam Township
- Bearville Township
- Bigfork Township
- Blackberry Township
- Bowstring Township
- Carpenter Township
- Deer River Township
- Feeley Township
- Good Hope Township
- Goodland Township
- Grand Rapids Township
- Grattan Township
- Greenway Township
- Harris Township
- Iron Range Township
- Kinghurst Township
- Lake Jessie Township
- Lawrence Township
- Lone Pine Township
- Marcell Township
- Max Township
- Moose Park Township
- Morse Township
- Nashwauk Township
- Nore Township
- Oteneagen Township
- Pomroy Township
- Sago Township
- Sand Lake Township
- Spang Township
- Splithand Township
- Stokes Township
- Third River Township
- Trout Lake Township
- Wabana Township
- Wawina Township
- Wildwood Township
- Wirt Township
Census-designated places
Other unincorporated communities
Unorganized territories
Politics
| Year | Republican | Democratic | Third parties |
|---|---|---|---|
| 2016 | 54.1% 12,920 | 37.8% 9,015 | 8.2% 1,945 |
| 2012 | 43.9% 10,501 | 53.7% 12,852 | 2.4% 566 |
| 2008 | 42.3% 10,309 | 55.2% 13,460 | 2.6% 626 |
| 2004 | 43.9% 10,705 | 54.5% 13,290 | 1.5% 372 |
| 2000 | 44.0% 9,545 | 48.7% 10,583 | 7.3% 1,586 |
| 1996 | 31.8% 6,506 | 52.3% 10,706 | 15.9% 3,261 |
| 1992 | 28.6% 5,952 | 46.2% 9,621 | 25.3% 5,265 |
| 1988 | 43.9% 8,358 | 55.2% 10,517 | 0.9% 178 |
| 1984 | 44.4% 9,306 | 54.7% 11,455 | 0.9% 187 |
| 1980 | 37.7% 8,368 | 54.6% 12,134 | 7.8% 1,726 |
| 1976 | 32.8% 6,646 | 64.0% 12,979 | 3.2% 656 |
| 1972 | 45.6% 7,558 | 52.4% 8,683 | 2.1% 342 |
| 1968 | 30.2% 4,898 | 64.9% 10,512 | 4.9% 796 |
| 1964 | 25.5% 4,137 | 74.3% 12,054 | 0.3% 40 |
| 1960 | 38.0% 6,615 | 61.8% 10,761 | 0.2% 32 |
| 1956 | 42.2% 6,408 | 57.6% 8,737 | 0.2% 33 |
| 1952 | 41.7% 6,573 | 57.8% 9,128 | 0.5% 81 |
| 1948 | 29.5% 4,334 | 65.6% 9,653 | 5.0% 729 |
| 1944 | 32.3% 4,227 | 67.1% 8,787 | 0.6% 81 |
| 1940 | 34.1% 5,196 | 64.9% 9,899 | 1.0% 159 |
| 1936 | 28.0% 3,594 | 69.4% 8,896 | 2.6% 329 |
| 1932 | 36.9% 3,782 | 54.9% 5,616 | 8.2% 839 |
| 1928 | 59.0% 5,103 | 36.1% 3,122 | 5.0% 431 |
| 1924 | 60.1% 4,961 | 6.0% 496 | 33.9% 2,798 |
| 1920 | 58.3% 3,973 | 28.3% 1,930 | 13.4% 910 |
| 1916 | 36.9% 1,163 | 47.7% 1,504 | 15.4% 486 |
| 1912 | 16.6% 446 | 26.0% 699 | 57.4% 1,544 |
| 1908 | 63.2% 1,883 | 22.9% 684 | 13.9% 415 |
| 1904 | 77.0% 1,796 | 12.6% 293 | 10.4% 243 |
| 1900 | 63.3% 770 | 34.0% 413 | 2.7% 33 |
| 1896 | 52.9% 826 | 46.4% 724 | 0.7% 11 |
| 1892 | 40.7% 520 | 53.6% 686 | 5.7% 73 |
See also
References
- ↑ "Minnesota Place Names". Minnesota Historical Society. Archived from the original on June 20, 2012. Retrieved March 18, 2014.
- 1 2 "State & County QuickFacts". United States Census Bureau. Archived from the original on July 12, 2011. Retrieved September 1, 2013.
- ↑ "Find a County". National Association of Counties. Archived from the original on 2011-05-31. Retrieved 2011-06-07.
- ↑ "2010 Census Gazetteer Files". United States Census Bureau. August 22, 2012. Archived from the original on October 6, 2014. Retrieved October 18, 2014.
- ↑ "Population and Housing Unit Estimates". Archived from the original on May 29, 2017. Retrieved June 9, 2017.
- ↑ "U.S. Decennial Census". United States Census Bureau. Archived from the original on May 12, 2015. Retrieved October 18, 2014.
- ↑ "Historical Census Browser". University of Virginia Library. Archived from the original on August 16, 2012. Retrieved October 18, 2014.
- ↑ "Population of Counties by Decennial Census: 1900 to 1990". United States Census Bureau. Archived from the original on August 4, 2014. Retrieved October 18, 2014.
- ↑ "Census 2000 PHC-T-4. Ranking Tables for Counties: 1990 and 2000" (PDF). United States Census Bureau. Archived (PDF) from the original on December 18, 2014. Retrieved October 18, 2014.
- ↑ Leip, David. "Dave Leip's Atlas of U.S. Presidential Elections". uselectionatlas.org. Archived from the original on 2018-03-23.
External links
- Itasca County government’s website
- Minnesota Department of Transportation map of Itasca County (southeastern portion, northwestern portion, northeastern portion)
Places adjacent to Itasca County, Minnesota | ||||||||||
|---|---|---|---|---|---|---|---|---|---|---|
| ||||||||||
Municipalities and communities of Itasca County, Minnesota, United States | ||
|---|---|---|
| Cities | | |
| Townships |
| |
| Unorganized territories | ||
| CDPs | ||
| Unincorporated communities | ||
| Indian reservations | ||
| Footnotes | ‡This populated place also has portions in an adjacent county or counties | |