Beltrami County, Minnesota
| Beltrami County, Minnesota | |
|---|---|
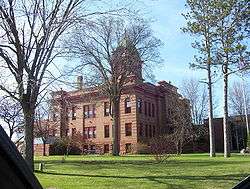 Beltrami County Courthouse | |
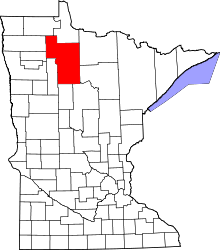 Location in the U.S. state of Minnesota | |
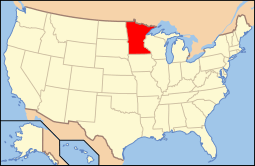 Minnesota's location in the U.S. | |
| Founded |
February 28, 1866 (created) 1896 (organized)[1] |
| Named for | Giacomo Constantino Beltrami |
| Seat | Bemidji |
| Largest city | Bemidji |
| Area | |
| • Total | 3,056 sq mi (7,915 km2) |
| • Land | 2,505 sq mi (6,488 km2) |
| • Water | 551 sq mi (1,427 km2), 18% |
| Population (est.) | |
| • (2016) | 46,106 |
| • Density | 18/sq mi (7/km2) |
| Congressional districts | 7th, 8th |
| Time zone | Central: UTC−6/−5 |
| Website |
www |
Beltrami County (/bɛlˈtræmiː/ bel-TRAM-ee) is a county located in the northern part of the U.S. state of Minnesota. As of the 2010 census, the population was 44,442.[2] Its county seat is Bemidji.[3] The county's name comes from the Italian count Giacomo Beltrami, who supposedly explored the area in 1825. The county was created in 1866 and organized in 1896.[4]
Beltrami County comprises the Bemidji, MN Micropolitan Statistical Area.
Portions of the Leech Lake and Red Lake Indian reservations are in the county. The northernmost portion of the Mississippi River flows through the southern part of the county, through the city of Bemidji. Beltrami County borders a total of nine counties, more than any other county in Minnesota, except for Renville County, which also borders nine counties.
Geography
According to the U.S. Census Bureau, the county has a total area of 3,056 square miles (7,920 km2), of which 2,505 square miles (6,490 km2) is land and 551 square miles (1,430 km2) (18%) is water.[5] It is the fourth-largest county in Minnesota by area.
Major highways
Adjacent counties
- Lake of the Woods County (north)
- Koochiching County (northeast)
- Itasca County (east)
- Cass County (southeast)
- Hubbard County (south)
- Clearwater County (southwest)
- Pennington County (west)
- Marshall County (west)
- Roseau County (northwest)
National protected area
- Chippewa National Forest (part)
Climate and weather
| Bemidji, Minnesota | ||||||||||||||||||||||||||||||||||||||||||||||||||||||||||||
|---|---|---|---|---|---|---|---|---|---|---|---|---|---|---|---|---|---|---|---|---|---|---|---|---|---|---|---|---|---|---|---|---|---|---|---|---|---|---|---|---|---|---|---|---|---|---|---|---|---|---|---|---|---|---|---|---|---|---|---|---|
| Climate chart (explanation) | ||||||||||||||||||||||||||||||||||||||||||||||||||||||||||||
| ||||||||||||||||||||||||||||||||||||||||||||||||||||||||||||
| ||||||||||||||||||||||||||||||||||||||||||||||||||||||||||||
In recent years, average temperatures in the county seat of Bemidji have ranged from a low of −4 °F (−20 °C) in January to a high of 79 °F (26 °C) in July, although a record low of −50 °F (−46 °C) was recorded in January 1950 and a record high of 101 °F (38 °C) was recorded in July 1975. Average monthly precipitation ranged from 0.59 inches (15 mm) in February to 4.33 inches (110 mm) in July.[6]
Demographics
| Historical population | |||
|---|---|---|---|
| Census | Pop. | %± | |
| 1870 | 80 | — | |
| 1880 | 10 | −87.5% | |
| 1890 | 312 | 3,020.0% | |
| 1900 | 11,030 | 3,435.3% | |
| 1910 | 19,337 | 75.3% | |
| 1920 | 27,079 | 40.0% | |
| 1930 | 20,707 | −23.5% | |
| 1940 | 26,107 | 26.1% | |
| 1950 | 24,962 | −4.4% | |
| 1960 | 23,425 | −6.2% | |
| 1970 | 26,373 | 12.6% | |
| 1980 | 30,982 | 17.5% | |
| 1990 | 34,384 | 11.0% | |
| 2000 | 39,650 | 15.3% | |
| 2010 | 44,442 | 12.1% | |
| Est. 2016 | 46,106 | [7] | 3.7% |
| U.S. Decennial Census[8] 1790-1960[9] 1900-1990[10] 1990-2000[11] 2010-2016[2] | |||

As of the 2000 census, there were 39,650 people, 14,337 households, and 9,749 families residing in the county. The population density was 16 people per square mile (6/km²). There were 16,989 housing units at an average density of 7 per square mile (3/km²). The racial makeup of the county was 76.66% White, 0.36% Black or African American, 20.36% Native American, 0.57% Asian, 0.02% Pacific Islander, 0.21% from other races, and 1.84% from two or more races. 0.99% of the population were Hispanic or Latino of any race. 21.6% were of German, 19.7% Norwegian and 5.6% Swedish ancestry. 95.1% spoke English and 2.4% Ojibwa as their first language.
There were 14,337 households out of which 34.60% had children under the age of 18 living with them, 49.30% were married couples living together, 13.60% had a female householder with no husband present, and 32.00% were non-families. 24.80% of all households were made up of individuals and 9.50% had someone living alone who was 65 years of age or older. The average household size was 2.63 and the average family size was 3.13.
In the county, the population was spread out with 28.70% under the age of 18, 13.90% from 18 to 24, 25.20% from 25 to 44, 20.50% from 45 to 64, and 11.70% who were 65 years of age or older. The median age was 32 years. For every 100 females there were 97.30 males. For every 100 females age 18 and over, there were 93.50 males.
The median income for a household in the county was $33,392, and the median income for a family was $40,345. Males had a median income of $30,434 versus $22,045 for females. The per capita income for the county was $15,497. About 12.90% of families and 17.60% of the population were below the poverty line, including 21.70% of those under age 18 and 12.20% of those age 65 or over.
Over half the children in the county are born out of wedlock. About a third are born to teenaged mothers. The county has about twice the state average in terms of high school dropouts.[12]
Crime
Between 1990 and 2005 the county had a suicide rate four times higher than the state.[13] The county exceeds the state and national rates in both violent and property crimes.[14] On 21 March 2005 ten people were murdered by a spree killer at the Red Lake Indian Reservation.[15]
Communities
Cities
Townships
- Alaska Township
- Battle Township
- Bemidji Township
- Benville Township
- Birch Township
- Buzzle Township
- Cormant Township
- Durand Township
- Eckles Township
- Frohn Township
- Grant Valley Township
- Hagali Township
- Hamre Township
- Hines Township
- Hornet Township
- Jones Township
- Kelliher Township
- Lammers Township
- Langor Township
- Lee Township
- Liberty Township
- Maple Ridge Township
- Minnie Township
- Moose Lake Township
- Nebish Township
- Northern Township
- O'Brien Township
- Port Hope Township
- Quiring Township
- Roosevelt Township
- Shooks Township
- Shotley Township
- Spruce Grove Township
- Steenerson Township
- Sugar Bush Township
- Summit Township
- Taylor Township
- Ten Lake Township
- Turtle Lake Township
- Turtle River Township
- Waskish Township
- Woodrow Township
Unorganized territories
Census-designated places
Unincorporated communities
Politics
| Year | Republican | Democratic | Third parties |
|---|---|---|---|
| 2016 | 50.0% 10,783 | 40.3% 8,688 | 9.7% 2,093 |
| 2012 | 43.7% 9,637 | 53.6% 11,818 | 2.7% 596 |
| 2008 | 43.9% 9,762 | 54.1% 12,019 | 2.1% 455 |
| 2004 | 48.5% 10,237 | 50.1% 10,592 | 1.4% 302 |
| 2000 | 48.5% 8,346 | 42.4% 7,301 | 9.1% 1,570 |
| 1996 | 36.6% 5,806 | 50.5% 8,006 | 12.9% 2,036 |
| 1992 | 32.6% 5,204 | 45.1% 7,210 | 22.4% 3,573 |
| 1988 | 46.3% 6,652 | 52.6% 7,566 | 1.1% 162 |
| 1984 | 49.4% 7,414 | 49.9% 7,481 | 0.7% 103 |
| 1980 | 41.7% 6,481 | 47.8% 7,432 | 10.5% 1,624 |
| 1976 | 39.3% 5,214 | 56.8% 7,540 | 4.0% 531 |
| 1972 | 52.2% 5,947 | 45.6% 5,194 | 2.2% 252 |
| 1968 | 40.9% 3,912 | 52.6% 5,034 | 6.5% 619 |
| 1964 | 34.7% 3,184 | 65.1% 5,967 | 0.2% 15 |
| 1960 | 49.0% 4,482 | 50.8% 4,653 | 0.2% 22 |
| 1956 | 51.0% 3,974 | 48.8% 3,807 | 0.2% 16 |
| 1952 | 53.8% 4,817 | 45.7% 4,092 | 0.6% 53 |
| 1948 | 32.6% 3,126 | 62.8% 6,020 | 4.5% 434 |
| 1944 | 32.8% 2,705 | 66.5% 5,490 | 0.7% 61 |
| 1940 | 32.8% 3,511 | 65.7% 7,036 | 1.6% 166 |
| 1936 | 24.4% 2,182 | 72.7% 6,507 | 3.0% 268 |
| 1932 | 32.1% 2,318 | 60.7% 4,386 | 7.2% 518 |
| 1928 | 62.3% 4,062 | 34.1% 2,221 | 3.7% 239 |
| 1924 | 46.2% 2,960 | 5.0% 323 | 48.7% 3,121 |
| 1920 | 61.3% 4,518 | 19.4% 1,427 | 19.4% 1,430 |
| 1916 | 33.0% 1,331 | 47.5% 1,912 | 19.5% 785 |
| 1912 | 16.2% 490 | 26.1% 790 | 57.7% 1,745 |
| 1908 | 63.4% 1,882 | 21.8% 648 | 14.8% 439 |
| 1904 | 82.4% 1,953 | 9.9% 234 | 7.8% 184 |
| 1900 | 62.1% 1,339 | 35.5% 767 | 2.4% 52 |
| 1896 | 48.0% 202 | 50.6% 213 | 1.4% 6 |
| 1892 | 44.9% 57 | 34.7% 44 | 20.5% 26 |
See also
- Gilfillan Biotic Area
- National Register of Historic Places listings in Beltrami County, Minnesota
- Red Lake, the largest lake that is entirely in Minnesota.
References
- ↑ "Minnesota Place Names". Minnesota Historical Society. Archived from the original on 2014-10-25. Retrieved March 17, 2014.
- 1 2 "State & County QuickFacts". United States Census Bureau. Retrieved August 31, 2013.
- ↑ "Find a County". National Association of Counties. Archived from the original on 2011-05-31. Retrieved 2011-06-07.
- ↑ Upham, Warren (1920). Minnesota Geographic Names: Their Origin and Historic Significance. Minnesota Historical Society. p. 34.
- ↑ "2010 Census Gazetteer Files". United States Census Bureau. August 22, 2012. Archived from the original on October 6, 2014. Retrieved October 5, 2014.
- 1 2 "Monthly Averages for Bemidji, Minnesota". The Weather Channel. Retrieved 2011-11-06.
- ↑ "Population and Housing Unit Estimates". Retrieved June 9, 2017.
- ↑ "U.S. Decennial Census". United States Census Bureau. Archived from the original on May 12, 2015. Retrieved October 5, 2014.
- ↑ "Historical Census Browser". University of Virginia Library. Retrieved October 5, 2014.
- ↑ "Population of Counties by Decennial Census: 1900 to 1990". United States Census Bureau. Retrieved October 5, 2014.
- ↑ "Census 2000 PHC-T-4. Ranking Tables for Counties: 1990 and 2000" (PDF). United States Census Bureau. Retrieved October 5, 2014.
- ↑ Dey, Crystal (11 November 2014). "Beltrami County children continue to struggle: New data shows higher than average poverty compared to state". Bemidii Pioneer. Retrieved 20 June 2018.
- ↑ Langman, Peter (January 6, 2009). Why Kids Kill (First ed.). St. Martin's Press. p. 137.
|access-date=requires|url=(help) - ↑ "Beltrami County, Minnesota". Sperling's Best Places. Retrieved 20 June 2018.
- ↑ Langman, Peter (January 6, 2009). Why Kids Kill (First ed.). St. Martin's Press. p. 137.
|access-date=requires|url=(help) - ↑ Leip, David. "Dave Leip's Atlas of U.S. Presidential Elections". uselectionatlas.org. Retrieved 2018-04-17.
External links
- Official website
- 360 Degree Virtual Tour of 2011 Beltrami County Fair
Places adjacent to Beltrami County, Minnesota | ||||||||||
|---|---|---|---|---|---|---|---|---|---|---|
| ||||||||||
Municipalities and communities of Beltrami County, Minnesota, United States | ||
|---|---|---|
| Cities | | |
| Townships |
| |
| CDPs | ||
| Unorganized territories | ||
| Unincorporated communities | ||
| Indian reservations | ||
| Footnotes | ‡This populated place also has portions in an adjacent county or counties | |