The 2000 United States presidential election in North Dakota took place on November 7, 2000, and was part of the 2000 United States presidential election. Voters chose 3 representatives, or electors to the Electoral College, who voted for president and vice president.
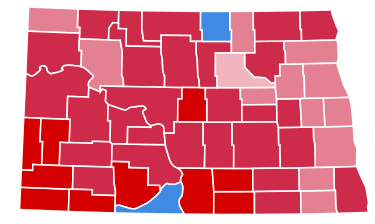
North Dakota was won by Governor George W. Bush with a double-digit margin of victory of 27.6%. Bush won most of the counties of the state. He won all but two counties: Rolette County, which Gore won with 61% of the vote and Sioux County, which Gore won with 70% of the vote. North Dakota gave Pat Buchanan his best performance in the nation with 2.5% of the vote,[1] whilst third-party candidates performed very well overall, obtaining a total of 6.6% of the vote.[2]
Winning 60.66% of the popular vote, North Dakota proved to be Bush's fifth strongest state in the 2000 election after Wyoming, Idaho, Utah and Nebraska[3].
Results
By county
| County |
Gore% |
Gore# |
Bush% |
Bush# |
Others% |
Others# |
Total |
| Adams County | 24.66% | 286 | 71.21% | 826 | 04.14% | 48 | 1,160 |
| Barnes County | 33.63% | 1,933 | 60.06% | 3,452 | 06.32% | 363 | 5,748 |
| Benson County | 44.20% | 952 | 48.98% | 1,055 | 06.82% | 147 | 2,154 |
| Billings County | 15.62% | 82 | 75.05% | 394 | 09.33% | 49 | 525 |
| Bottineau County | 31.79% | 1,173 | 63.66% | 2,349 | 04.55% | 168 | 3,690 |
| Bowman County | 22.43% | 330 | 73.42% | 1,080 | 04.15% | 61 | 1,471 |
| Burke County | 28.49% | 296 | 67.18% | 698 | 04.33% | 45 | 1,039 |
| Burleigh County | 28.54% | 9,842 | 65.16% | 22,467 | 06.30% | 2,173 | 34,482 |
| Cass County | 36.36% | 21,451 | 56.85% | 33,536 | 06.79% | 4,008 | 58,995 |
| Cavalier County | 26.06% | 618 | 63.81% | 1,513 | 10.12% | 240 | 2,371 |
| Dickey County | 28.93% | 806 | 66.51% | 1,853 | 04.56% | 127 | 2,786 |
| Divide County | 38.54% | 306 | 55.79% | 443 | 05.67% | 45 | 794 |
| Dunn County | 27.43% | 474 | 65.05% | 1,124 | 07.52% | 130 | 1,728 |
| Eddy County | 36.12% | 458 | 55.44% | 703 | 08.44% | 107 | 1,268 |
| Emmons County | 20.33% | 405 | 71.79% | 1,430 | 07.88% | 157 | 1,992 |
| Foster County | 27.19% | 474 | 67.24% | 1,172 | 05.57% | 97 | 1,743 |
| Golden Valley County | 19.21% | 156 | 75.25% | 611 | 05.54% | 45 | 812 |
| Grand Forks County | 37.32% | 10,593 | 55.93% | 15,875 | 06.75% | 1,917 | 28,385 |
| Grant County | 16.47% | 235 | 75.47% | 1,077 | 08.06% | 115 | 1,427 |
| Griggs County | 32.95% | 484 | 62.63% | 920 | 04.42% | 65 | 1,469 |
| Hettinger County | 23.24% | 353 | 69.59% | 1,057 | 07.18% | 109 | 1,519 |
| Kidder County | 22.18% | 283 | 65.60% | 837 | 12.23% | 156 | 1,276 |
| LaMoure County | 27.92% | 689 | 64.42% | 1,590 | 07.66% | 189 | 2,468 |
| Logan County | 19.48% | 223 | 70.92% | 812 | 09.61% | 110 | 1,145 |
| McHenry County | 32.44% | 888 | 61.45% | 1,682 | 06.10% | 167 | 2,737 |
| McIntosh County | 21.53% | 350 | 72.45% | 1,178 | 06.03% | 98 | 1,626 |
| McKenzie County | 27.62% | 653 | 69.12% | 1,634 | 03.26% | 77 | 2,364 |
| McLean County | 31.53% | 1,465 | 62.23% | 2,891 | 06.24% | 290 | 4,646 |
| Mercer County | 23.23% | 1,011 | 68.55% | 2,984 | 08.22% | 358 | 4,353 |
| Morton County | 30.64% | 3,439 | 62.31% | 6,993 | 07.05% | 791 | 11,223 |
| Mountrail County | 43.37% | 1,256 | 50.62% | 1,466 | 06.01% | 174 | 2,896 |
| Nelson County | 37.34% | 687 | 56.03% | 1,031 | 06.63% | 122 | 1,840 |
| Oliver County | 23.22% | 244 | 67.46% | 709 | 09.32% | 98 | 1,051 |
| Pembina County | 28.92% | 1,093 | 64.30% | 2,430 | 06.77% | 256 | 3,779 |
| Pierce County | 25.37% | 500 | 68.39% | 1,348 | 06.24% | 123 | 1,971 |
| Ramsey County | 33.31% | 1,658 | 60.38% | 3,005 | 06.31% | 314 | 4,977 |
| Ransom County | 39.72% | 1,080 | 54.73% | 1,488 | 05.55% | 151 | 2,719 |
| Renville County | 33.26% | 443 | 61.56% | 820 | 05.18% | 69 | 1,332 |
| Richland County | 31.07% | 2,490 | 62.37% | 4,999 | 06.56% | 526 | 8,015 |
| Rolette County | 60.96% | 2,681 | 32.20% | 1,416 | 06.84% | 301 | 4,398 |
| Sargent County | 43.91% | 959 | 50.50% | 1,103 | 05.59% | 122 | 2,184 |
| Sheridan County | 17.35% | 161 | 76.19% | 707 | 06.47% | 60 | 928 |
| Sioux County | 69.55% | 724 | 25.84% | 269 | 04.61% | 48 | 1,041 |
| Slope County | 19.23% | 85 | 71.49% | 316 | 09.28% | 41 | 442 |
| Stark County | 28.47% | 2,784 | 65.33% | 6,387 | 06.20% | 606 | 9,777 |
| Steele County | 39.26% | 475 | 54.13% | 655 | 06.61% | 80 | 1,210 |
| Stutsman County | 33.64% | 3,067 | 60.19% | 5,488 | 06.17% | 563 | 9,118 |
| Towner County | 34.48% | 410 | 58.37% | 694 | 07.15% | 85 | 1,189 |
| Traill County | 36.77% | 1,512 | 58.17% | 2,392 | 05.06% | 208 | 4,112 |
| Walsh County | 33.64% | 1,743 | 59.80% | 3,099 | 06.56% | 340 | 5,182 |
| Ward County | 33.51% | 7,533 | 62.26% | 13,997 | 04.23% | 952 | 22,482 |
| Wells County | 27.43% | 661 | 66.80% | 1,610 | 05.77% | 139 | 2,410 |
| Williams County | 29.85% | 2,330 | 66.44% | 5,187 | 03.71% | 290 | 7,807 |
Electors
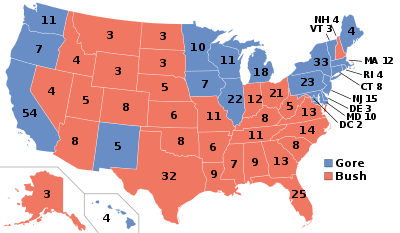
Technically the voters of North Dakota cast their ballots for electors: representatives to the Electoral College. North Dakota is allocated 3 electors because it has 1 congressional districts and 2 senators. All candidates who appear on the ballot or qualify to receive write-in votes must submit a list of 3 electors, who pledge to vote for their candidate and his or her running mate. Whoever wins the majority of votes in the state is awarded all 3 electoral votes. Their chosen electors then vote for president and vice president. Although electors are pledged to their candidate and running mate, they are not obligated to vote for them. An elector who votes for someone other than his or her candidate is known as a faithless elector.
The electors of each state and the District of Columbia met on December 18, 2000[4] to cast their votes for president and vice president. The Electoral College itself never meets as one body. Instead the electors from each state and the District of Columbia met in their respective capitols.
The following were the members of the Electoral College from the state. All were pledged to and voted for George W. Bush and Dick Cheney:[5]
- Rosemarie Myrdal
- Edward T. Schafer
- Bryce Steibel
References
|
|---|
| Candidates | | |
|---|
General
articles | |
|---|
Local
results | |
|---|
Other 2000
elections | |
|---|