United States presidential election in Massachusetts, 2000
|
| |||||||||||||||||||||||||||||||||
| |||||||||||||||||||||||||||||||||
| |||||||||||||||||||||||||||||||||
 County Results
Gore 50–60%
60–70%
70–80% | |||||||||||||||||||||||||||||||||
| |||||||||||||||||||||||||||||||||


| Elections in Massachusetts | ||||
|---|---|---|---|---|
 | ||||
|
||||
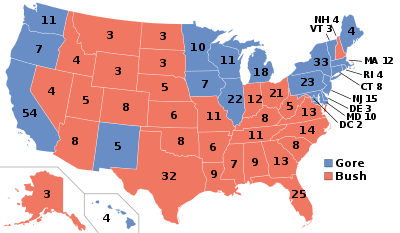
The 2000 United States presidential election in Massachusetts took place on November 7, 2000, and was part of the 2000 United States presidential election. Voters chose 12 representatives, or electors to the Electoral College, who voted for president and vice president.
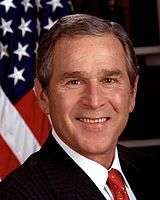
Massachusetts is one of the most reliable blue states in the nation: no Republican has won the state since Ronald Reagan in 1984. The 2000 Presidential election featured Democratic United States Vice President Al Gore versus Republican Texas Governor George W. Bush. Despite Bush's tight victory nationwide, Gore handily won Massachusetts, with a 27% margin of victory against George W. Bush who did not actively campaign there. Gore won every county and congressional district.
Results
Vice President Al Gore easily defeated Texas Governor George W. Bush in Massachusetts. Massachusetts is one of the most reliable Democratic States in the union. Gore won every single county in Massachusetts.
With 6.42% of the popular vote, Massachusetts proved to be Ralph Nader's third strongest victory in the 2000 election after Alaska and neighboring Vermont[1].
| United States presidential election in Massachusetts, 2004 | |||||
|---|---|---|---|---|---|
| Party | Candidate | Votes | Percentage | Electoral votes | |
| Democratic | Al Gore | 1,616,487 | 59.80% | 12 | |
| Republican | George W. Bush | 878,502 | 32.50% | 0 | |
| Green | Ralph Nader | 173,564 | 6.42% | 0 | |
| Libertarian | Harry Browne | 16,366 | 0.61% | 0 | |
| Reform | Pat Buchanan | 11,149 | 0.41% | 0 | |
| Independent | Others (Write-In) | 3,990 | 0.15% | 0 | |
| Independent (a) | John Hagelin | 2,884 | 0.11% | 0 | |
| Socialist | David McReynolds (Write-In) | 42 | 0.15% | 0 | |
| Totals | 2,702,984 | 100.0% | 12 | ||
|} (a) John Hagelin was the candidate of the Natural Law Party nationally.
Results breakdown
By county
| County | Gore% | Gore# | Bush% | Bush# | Others% | Others# | Total |
|---|---|---|---|---|---|---|---|
| Barnstable County | 51.50% | 62,363 | 41.03% | 49,686 | 7.46% | 9,037 | 121,086 |
| Berkshire County | 63.85% | 37,934 | 26.60% | 15,805 | 9.55% | 5,672 | 59,411 |
| Bristol County | 64.51% | 136,325 | 29.74% | 62,848 | 5.76% | 12,164 | 211,337 |
| Dukes County | 61.81% | 5,474 | 26.14% | 2,315 | 12.05% | 1,067 | 8,856 |
| Essex County | 57.49% | 178,400 | 35.45% | 110,010 | 7.06% | 21,923 | 310,333 |
| Franklin County | 53.78% | 17,945 | 30.50% | 10,176 | 15.72% | 5,245 | 33,366 |
| Hampden County | 58.17% | 100,103 | 34.61% | 59,558 | 7.22% | 12,432 | 172,093 |
| Hampshire County | 56.16% | 38,543 | 27.98% | 19,202 | 15.86% | 10,881 | 68,626 |
| Middlesex County | 61.49% | 404,043 | 30.27% | 198,914 | 8.23% | 54,091 | 657,048 |
| Nantucket County | 58.34% | 2,874 | 32.97% | 1,624 | 8.69% | 428 | 4,926 |
| Norfolk County | 59.41% | 188,450 | 33.75% | 107,033 | 6.84% | 21,694 | 317,177 |
| Plymouth County | 54.53% | 115,376 | 39.11% | 82,751 | 6.36% | 13,450 | 211,577 |
| Suffolk County | 71.38% | 154,888 | 20.48% | 44,441 | 8.14% | 17,671 | 217,000 |
| Worcester County | 56.02% | 173,679 | 36.81% | 114,139 | 7.17% | 22,240 | 310,058 |
Results by municipality

References
- ↑ "2000 Presidential Election Statistics". Dave Leip’s Atlas of U.S. Presidential Elections. Retrieved 2018-03-05.