The 2000 United States presidential election in Michigan took place on November 7, 2000, and was part of the 2000 United States presidential election. Voters chose 18 representatives, or electors to the Electoral College, who voted for president and vice president.
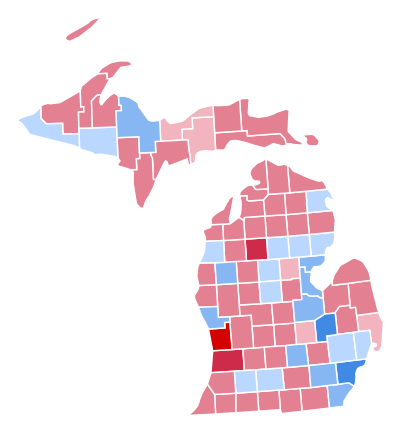
Michigan was won by Vice President Al Gore by a sizable margin of 5.2%. The western part of the state, which is more rural, was overwhelmingly Republican and Bush won most of the congressional districts and counties in that region of the state. His best performance was in Ottawa County, where he won with over 70%. Gore did fairly well in the eastern region of the state. His best performance was in Wayne County, the highest populated county in the state and home of the city of Detroit. He won the county with 69%, with his second best performance in Genesee County, where he got over 62% of the vote.[1]
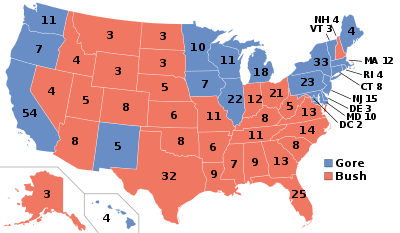
This election marked the first time since 1976 in which Michigan's electoral votes did not go to the overall winner of the general election, although the state was carried by the candidate who ultimately lead in the popular vote.
Results
| United States presidential election in Michigan, 2000 |
| Party |
Candidate |
Running mate |
Votes |
Percentage |
Electoral votes |
|
Democratic |
Al Gore |
Joe Lieberman |
2,170,418 |
51.3% |
18 |
|
Republican |
George W. Bush |
Dick Cheney |
1,953,139 |
46.1% |
0 |
|
Green |
Ralph Nader |
Winona LaDuke |
84,165 |
2.0% |
0 |
|
Libertarian |
Harry Browne |
Art Olivier |
16,711 |
0.4% |
0 |
|
U.S. Taxpayers |
Howard Phillips |
Michael Peroutka |
3,791 |
0.1 |
0 |
|
Natural Law |
John Hagelin |
Mary Alice Herbert |
2,426 |
0.1% |
0 |
|
Write In |
Patrick Buchanan |
|
2,061 |
0.1% |
0 |
|
| Totals |
4,232,711 |
100.00% |
3 |
| Voter turnout (Voting age/Registered) |
58%/62% |
By congressional district
Gore won 9 of 16 congressional districts. Both candidates won 2 districts won by the opposite party.[2]
By county
| County |
Gore% |
Gore# |
Bush% |
Bush# |
Others% |
Others# |
Total |
| Alcona County | 44.96% | 2,696 | 52.56% | 3,152 | 02.48% | 149 | 5,997 |
| Alger County | 47.43% | 2,071 | 49.06% | 2,142 | 03.50% | 153 | 4,366 |
| Allegan County | 34.52% | 15,495 | 62.81% | 28,197 | 02.67% | 1,199 | 44,891 |
| Alpena County | 49.91% | 7,053 | 47.90% | 6,769 | 02.19% | 310 | 14,132 |
| Antrim County | 37.62% | 4,329 | 58.92% | 6,780 | 03.46% | 398 | 11,507 |
| Arenac County | 50.71% | 3,685 | 47.08% | 3,421 | 02.22% | 161 | 7,267 |
| Baraga County | 41.26% | 1,400 | 54.11% | 1,836 | 04.63% | 157 | 3,393 |
| Barry County | 37.22% | 9,769 | 59.88% | 15,716 | 02.89% | 759 | 26,244 |
| Bay County | 54.71% | 28,251 | 42.90% | 22,150 | 02.39% | 1,235 | 51,636 |
| Benzie County | 43.93% | 3,546 | 51.68% | 4,172 | 04.39% | 354 | 8,072 |
| Berrien County | 43.15% | 28,152 | 54.70% | 35,689 | 02.15% | 1,400 | 65,241 |
| Branch County | 42.39% | 6,691 | 55.40% | 8,743 | 02.21% | 349 | 15,783 |
| Calhoun County | 49.59% | 27,312 | 47.73% | 26,291 | 02.68% | 1,477 | 55,080 |
| Cass County | 44.43% | 8,808 | 53.19% | 10,545 | 02.38% | 472 | 19,825 |
| Charlevoix County | 39.71% | 4,958 | 56.20% | 7,018 | 04.09% | 511 | 12,487 |
| Cheboygan County | 43.47% | 5,484 | 54.01% | 6,815 | 02.52% | 318 | 12,617 |
| Chippewa County | 44.38% | 6,370 | 52.43% | 7,526 | 03.19% | 458 | 14,354 |
| Clare County | 49.87% | 6,287 | 47.09% | 5,937 | 03.04% | 383 | 12,607 |
| Clinton County | 41.60% | 13,394 | 56.07% | 18,054 | 02.33% | 751 | 32,199 |
| Crawford County | 43.84% | 2,790 | 52.56% | 3,345 | 03.60% | 229 | 6,364 |
| Delta County | 46.03% | 7,970 | 51.23% | 8,871 | 02.74% | 475 | 17,316 |
| Dickinson County | 43.12% | 5,533 | 54.02% | 6,932 | 02.86% | 367 | 12,832 |
| Eaton County | 47.11% | 23,211 | 50.34% | 24,803 | 02.55% | 1,258 | 49,272 |
| Emmet County | 37.05% | 5,451 | 58.47% | 8,602 | 04.47% | 658 | 14,711 |
| Genesee County | 62.78% | 119,833 | 34.92% | 66,641 | 02.30% | 4,391 | 190,865 |
| Gladwin County | 47.92% | 5,573 | 49.39% | 5,743 | 02.69% | 313 | 11,629 |
| Gogebic County | 48.76% | 4,066 | 47.12% | 3,929 | 04.13% | 344 | 8,339 |
| Grand Traverse County | 37.59% | 14,371 | 58.48% | 22,358 | 03.92% | 1,500 | 38,229 |
| Gratiot County | 43.07% | 6,538 | 54.76% | 8,312 | 02.17% | 329 | 15,179 |
| Hillsdale County | 37.17% | 6,495 | 60.00% | 10,483 | 02.83% | 495 | 17,473 |
| Houghton County | 40.01% | 5,688 | 55.54% | 7,895 | 04.45% | 633 | 14,216 |
| Huron County | 42.86% | 6,899 | 55.37% | 8,911 | 01.77% | 285 | 16,095 |
| Ingham County | 57.41% | 69,231 | 39.23% | 47,314 | 03.36% | 4,050 | 120,595 |
| Ionia County | 39.55% | 9,481 | 58.05% | 13,915 | 02.39% | 574 | 23,970 |
| Iosco County | 49.20% | 6,505 | 47.99% | 6,345 | 02.81% | 372 | 13,222 |
| Iron County | 48.71% | 3,014 | 47.95% | 2,967 | 03.35% | 207 | 6,188 |
| Isabella County | 48.55% | 10,228 | 47.71% | 10,053 | 03.74% | 788 | 21,069 |
| Jackson County | 45.46% | 28,160 | 51.76% | 32,066 | 02.78% | 1,720 | 61,946 |
| Kalamazoo County | 48.49% | 48,807 | 47.94% | 48,254 | 03.57% | 3,595 | 100,656 |
| Kalkaska County | 40.50% | 2,774 | 56.10% | 3,842 | 03.40% | 233 | 6,849 |
| Kent County | 38.13% | 95,442 | 59.37% | 148,602 | 02.51% | 6,274 | 250,318 |
| Keweenaw County | 40.21% | 540 | 55.10% | 740 | 04.69% | 63 | 1,343 |
| Lake County | 55.06% | 2,584 | 41.79% | 1,961 | 03.15% | 148 | 4,693 |
| Lapeer County | 42.30% | 15,749 | 54.66% | 20,351 | 03.05% | 1,134 | 37,234 |
| Leelanau County | 38.60% | 4,635 | 56.96% | 6,840 | 04.45% | 534 | 12,009 |
| Lenawee County | 45.81% | 18,365 | 51.58% | 20,681 | 02.61% | 1,047 | 40,093 |
| Livingston County | 38.13% | 28,780 | 59.14% | 44,637 | 02.73% | 2,058 | 75,475 |
| Luce County | 37.70% | 956 | 58.36% | 1,480 | 03.94% | 100 | 2,536 |
| Mackinac County | 42.43% | 2,533 | 54.81% | 3,272 | 02.76% | 165 | 5,970 |
| Macomb County | 49.96% | 172,625 | 47.54% | 164,265 | 02.51% | 8,669 | 345,559 |
| Manistee County | 49.34% | 5,639 | 47.26% | 5,401 | 03.40% | 388 | 11,428 |
| Marquette County | 53.13% | 15,503 | 43.10% | 12,577 | 03.77% | 1,099 | 29,179 |
| Mason County | 42.86% | 5,579 | 54.29% | 7,066 | 02.85% | 371 | 13,016 |
| Mecosta County | 42.70% | 6,300 | 54.71% | 8,072 | 02.59% | 382 | 14,754 |
| Menominee County | 44.06% | 4,597 | 52.99% | 5,529 | 02.95% | 308 | 10,434 |
| Midland County | 41.04% | 15,959 | 56.28% | 21,887 | 02.68% | 1,042 | 38,888 |
| Missaukee County | 31.74% | 2,062 | 65.79% | 4,274 | 02.46% | 160 | 6,496 |
| Monroe County | 51.06% | 31,555 | 46.83% | 28,940 | 02.10% | 1,300 | 61,795 |
| Montcalm County | 42.03% | 9,627 | 55.43% | 12,696 | 02.54% | 581 | 22,904 |
| Montmorency County | 42.70% | 2,139 | 54.90% | 2,750 | 02.40% | 120 | 5,009 |
| Muskegon County | 54.66% | 37,865 | 43.35% | 30,028 | 01.99% | 1,377 | 69,270 |
| Newaygo County | 39.25% | 7,677 | 58.29% | 11,399 | 02.46% | 481 | 19,557 |
| Oakland County | 49.31% | 281,201 | 48.10% | 274,319 | 02.59% | 14,745 | 570,265 |
| Oceana County | 42.68% | 4,597 | 54.89% | 5,913 | 02.43% | 262 | 10,772 |
| Ogemaw County | 49.68% | 4,896 | 47.75% | 4,706 | 02.57% | 253 | 9,855 |
| Ontonagon County | 36.47% | 1,514 | 59.55% | 2,472 | 03.97% | 165 | 4,151 |
| Osceola County | 40.34% | 4,006 | 57.20% | 5,680 | 02.46% | 244 | 9,930 |
| Oscoda County | 42.01% | 1,677 | 55.29% | 2,207 | 02.71% | 108 | 3,992 |
| Otsego County | 38.40% | 4,034 | 58.14% | 6,108 | 03.46% | 363 | 10,505 |
| Ottawa County | 26.76% | 29,600 | 71.16% | 78,703 | 02.08% | 2,296 | 110,599 |
| Presque Isle County | 45.79% | 3,242 | 51.69% | 3,660 | 02.51% | 178 | 7,080 |
| Roscommon County | 49.76% | 6,433 | 47.88% | 6,190 | 02.36% | 305 | 12,928 |
| Saginaw County | 54.21% | 50,825 | 43.89% | 41,152 | 01.90% | 1,779 | 93,756 |
| St. Clair County | 48.17% | 33,002 | 49.00% | 33,571 | 02.84% | 1,943 | 68,516 |
| St. Joseph County | 38.93% | 8,574 | 58.60% | 12,906 | 02.47% | 544 | 22,024 |
| Sanilac County | 38.53% | 7,153 | 59.06% | 10,966 | 02.41% | 447 | 18,566 |
| Schoolcraft County | 48.50% | 2,036 | 49.74% | 2,088 | 01.76% | 74 | 4,198 |
| Shiawassee County | 48.17% | 15,520 | 49.09% | 15,816 | 02.74% | 882 | 32,218 |
| Tuscola County | 43.99% | 10,845 | 53.60% | 13,213 | 02.41% | 594 | 24,652 |
| Van Buren County | 46.79% | 13,796 | 50.17% | 14,792 | 03.03% | 894 | 29,482 |
| Washtenaw County | 59.78% | 86,647 | 36.19% | 52,459 | 04.03% | 5,834 | 144,940 |
| Wayne County | 69.03% | 530,414 | 29.02% | 223,021 | 01.95% | 14,982 | 768,417 |
| Wexford County | 41.03% | 5,326 | 55.58% | 7,215 | 03.40% | 441 | 12,982 |
Electors
Technically the voters of Michigan cast their ballots for electors: representatives to the Electoral College. Michigan is allocated 18 electors because it has 18 congressional districts and 2 senators. All candidates who appear on the ballot or qualify to receive write-in votes must submit a list of 18 electors, who pledge to vote for their candidate and his or her running mate. Whoever wins the majority of votes in the state is awarded all 18 electoral votes. Their chosen electors then vote for president and vice president. Although electors are pledged to their candidate and running mate, they are not obligated to vote for them. An elector who votes for someone other than his or her candidate is known as a faithless elector.
The electors of each state and the District of Columbia met on December 18, 2000[3] to cast their votes for president and vice president. The Electoral College itself never meets as one body. Instead the electors from each state and the District of Columbia met in their respective capitols.
The following were the members of the Electoral College from the state. All were pledged to and voted for Gore and Lieberman:[4]
- Lana Boldi
- John Cherry
- Patty Fedewa
- Sigrid L. Grace
- Dona Jean Graham
- Freman Hendrix
- Jeff Jenks
- John Kelly
- Don Oetman
- Ken Oke
- Charles Prather
- Jim Ramey
- Iris K. Salters
- Judith L. Strong
- David P. Taylor
- Juli Trudell
- Mary Warner
- Marie Weigold
References
|
|---|
| Candidates | | |
|---|
General
articles | |
|---|
Local
results | |
|---|
Other 2000
elections | |
|---|