Electors
The electors of each state and the District of Columbia met on December 18, 2000[1] to cast their votes for president and vice president. The Electoral College itself never meets as one body. Instead the electors from each state and the District of Columbia met in their respective capitols.
The following were the members of the Electoral College from the state. All were pledged to and voted for Al Gore and Joe Lieberman:[2]
- Alice Clausing
- Pedro Colon
- Paulette Copeland
- Reynolds Honold
- Joan Kaeding
- Mark McQuate
- Ruth Miner-Kessel
- Christine Sinicki
- Tim Sullivan
- Angela Sutkiewicz
- Charlie Wolden
Results
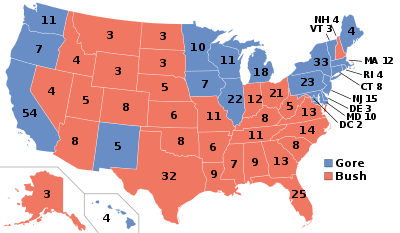
Wisconsin was won by a narrow margin by Gore by some 5,000 votes. Gore carried Milwaukee County home of Milwaukee, and Dane County home of Madison, which contributed to his victory.
By Congressional District
Gore won 5 of the 9 congressional districts. Both candidates won a district held by the opposite party.[4]
By county
| County |
Gore% |
Gore# |
Bush% |
Bush# |
Others% |
Others# |
Total |
| Adams County | 52.94% | 4,826 | 43.00% | 3,920 | 4.06% | 370 | 9,116 |
| Ashland County | 55.21% | 4,356 | 38.50% | 3,038 | 6.29% | 496 | 7,890 |
| Barron County | 44.86% | 8,928 | 49.48% | 9,848 | 5.67% | 1,128 | 19,904 |
| Bayfield County | 53.60% | 4,427 | 39.54% | 3,266 | 6.85% | 566 | 8,259 |
| Brown County | 45.56% | 49,096 | 50.35% | 54,258 | 4.1% | 4,415 | 107,769 |
| Buffalo County | 48.74% | 3,237 | 45.75% | 3,038 | 5.51% | 366 | 6,641 |
| Burnett County | 44.49% | 3,626 | 48.67% | 3,967 | 6.85% | 558 | 8,151 |
| Calumet County | 41.12% | 8,202 | 54.33% | 10,837 | 4.55% | 908 | 19,947 |
| Chippewa County | 46.24% | 12,102 | 49.04% | 12,835 | 4.72% | 1,236 | 26,173 |
| Clark County | 41.92% | 5,931 | 52.73% | 7,461 | 5.35% | 757 | 14,149 |
| Columbia County | 49.38% | 12,636 | 46.85% | 11,987 | 3.77% | 964 | 25,587 |
| Crawford County | 54.17% | 4,005 | 40.90% | 3,024 | 4.94% | 365 | 7,394 |
| Dane County | 61.15% | 142,317 | 32.56% | 75,790 | 6.29% | 14,632 | 232,739 |
| Dodge County | 38.67% | 14,580 | 57.52% | 21,684 | 3.81% | 1,437 | 37,701 |
| Door County | 43.10% | 6,560 | 51.31% | 7,810 | 5.58% | 850 | 15,220 |
| Douglas County | 62.62% | 13,593 | 31.93% | 6,930 | 5.45% | 1,183 | 21,706 |
| Dunn County | 47.45% | 9,172 | 46.10% | 8,911 | 6.45% | 1,247 | 19,330 |
| Eau Claire County | 50.29% | 24,078 | 43.70% | 20,921 | 6.01% | 2,876 | 47,875 |
| Florence County | 33.93% | 816 | 63.53% | 1,528 | 2.54% | 61 | 2,405 |
| Fond du Lac County | 39.02% | 18,181 | 56.98% | 26,548 | 3.99% | 1,860 | 46,589 |
| Forest County | 45.76% | 2,158 | 50.98% | 2,404 | 3.27% | 154 | 4,716 |
| Grant County | 48.69% | 10,691 | 46.64% | 10,240 | 4.67% | 1,025 | 21,956 |
| Green County | 51.47% | 7,863 | 44.45% | 6,790 | 4.08% | 623 | 15,276 |
| Green Lake County | 36.25% | 3,301 | 59.86% | 5,451 | 3.9% | 355 | 9,107 |
| Iowa County | 55.42% | 5,842 | 40.04% | 4,221 | 4.53% | 478 | 10,541 |
| Iron County | 46.19% | 1,620 | 49.44% | 1,734 | 4.36% | 153 | 3,507 |
| Jackson County | 52.04% | 4,380 | 43.60% | 3,670 | 4.36% | 367 | 8,417 |
| Jefferson County | 42.11% | 15,203 | 53.20% | 19,204 | 4.69% | 1,692 | 36,099 |
| Juneau County | 47.10% | 4,813 | 48.05% | 4,910 | 4.84% | 495 | 10,218 |
| Kenosha County | 50.90% | 32,429 | 45.35% | 28,891 | 3.75% | 2,389 | 63,709 |
| Kewaunee County | 46.31% | 4,670 | 48.42% | 4,883 | 5.27% | 531 | 10,084 |
| La Crosse County | 51.22% | 28,455 | 43.79% | 24,327 | 5.% | 2,777 | 55,559 |
| Lafayette County | 51.08% | 3,710 | 45.93% | 3,336 | 2.99% | 217 | 7,263 |
| Langlade County | 43.20% | 4,199 | 52.72% | 5,125 | 4.08% | 397 | 9,721 |
| Lincoln County | 46.80% | 6,664 | 47.24% | 6,727 | 5.96% | 848 | 14,239 |
| Manitowoc County | 45.51% | 17,667 | 49.86% | 19,358 | 4.63% | 1,799 | 38,824 |
| Marathon County | 45.48% | 26,546 | 49.48% | 28,883 | 5.05% | 2,945 | 58,374 |
| Marinette County | 43.55% | 8,676 | 52.88% | 10,535 | 3.56% | 710 | 19,921 |
| Marquette County | 47.78% | 3,437 | 48.96% | 3,522 | 3.27% | 235 | 7,194 |
| Menominee County | 76.97% | 949 | 18.25% | 225 | 4.79% | 59 | 1,233 |
| Milwaukee County | 58.20% | 252,329 | 37.71% | 163,491 | 4.09% | 17,717 | 433,537 |
| Monroe County | 45.67% | 7,460 | 50.30% | 8,217 | 4.03% | 658 | 16,335 |
| Oconto County | 43.75% | 7,260 | 52.46% | 8,706 | 3.8% | 630 | 16,596 |
| Oneida County | 44.14% | 8,339 | 50.35% | 9,512 | 5.51% | 1,040 | 18,891 |
| Outagamie County | 43.22% | 32,735 | 52.10% | 39,460 | 4.68% | 3,547 | 75,742 |
| Ozaukee County | 31.48% | 15,030 | 65.24% | 31,155 | 3.28% | 1,566 | 47,751 |
| Pepin County | 50.60% | 1,854 | 44.51% | 1,631 | 4.89% | 179 | 3,664 |
| Pierce County | 47.65% | 8,559 | 45.48% | 8,169 | 6.87% | 1,234 | 17,962 |
| Polk County | 45.34% | 8,961 | 48.36% | 9,557 | 6.29% | 1,244 | 19,762 |
| Portage County | 53.15% | 17,942 | 39.14% | 13,214 | 7.71% | 2,604 | 33,760 |
| Price County | 43.04% | 3,413 | 52.16% | 4,136 | 4.8% | 381 | 7,930 |
| Racine County | 46.77% | 41,563 | 49.53% | 44,014 | 3.7% | 3,288 | 88,865 |
| Richland County | 46.27% | 3,837 | 48.16% | 3,994 | 5.57% | 462 | 8,293 |
| Rock County | 57.49% | 40,472 | 39.01% | 27,467 | 3.5% | 2,465 | 70,404 |
| Rusk County | 42.91% | 3,161 | 51.02% | 3,758 | 6.07% | 447 | 7,366 |
| St. Croix County | 50.81% | 13,035 | 45.16% | 11,586 | 4.02% | 1,032 | 25,653 |
| Sauk County | 42.91% | 3,333 | 51.14% | 3,972 | 5.95% | 462 | 7,767 |
| Sawyer County | 41.67% | 7,335 | 54.24% | 9,548 | 4.09% | 720 | 17,603 |
| Shawano County | 42.70% | 23,569 | 53.71% | 29,648 | 3.59% | 1,984 | 55,201 |
| Sheboygan County | 43.66% | 13,077 | 50.88% | 15,240 | 5.47% | 1,637 | 29,954 |
| Taylor County | 36.19% | 3,254 | 58.70% | 5,278 | 5.12% | 460 | 8,992 |
| Trempealeau County | 54.88% | 6,678 | 41.11% | 5,002 | 4.01% | 488 | 12,168 |
| Vernon County | 50.42% | 6,577 | 43.58% | 5,684 | 6.% | 783 | 13,044 |
| Vilas County | 38.19% | 4,706 | 56.47% | 6,958 | 5.34% | 658 | 12,322 |
| Walworth County | 38.29% | 15,492 | 56.80% | 22,982 | 4.9% | 1,984 | 40,458 |
| Washburn County | 45.93% | 3,695 | 48.63% | 3,912 | 5.44% | 438 | 8,045 |
| Washington County | 29.50% | 18,115 | 67.03% | 41,162 | 3.48% | 2,135 | 61,412 |
| Waukesha County | 31.57% | 64,319 | 65.33% | 133,105 | 3.1% | 6,310 | 203,734 |
| Waupaca County | 38.53% | 8,787 | 56.92% | 12,980 | 4.55% | 1,037 | 22,804 |
| Waushara County | 41.36% | 4,239 | 54.36% | 5,571 | 4.27% | 438 | 10,248 |
| Winnebago County | 44.67% | 33,983 | 50.38% | 38,330 | 4.95% | 3,767 | 76,080 |
| Wood County | 44.56% | 15,936 | 49.78% | 17,803 | 5.65% | 2,022 | 35,761 |
See also
|
|---|
| Candidates | | |
|---|
General
articles | |
|---|
Local
results | |
|---|
Other 2000
elections | |
|---|