United States presidential election in West Virginia, 2000
|
|
|
|
|
 County Results
|
Bush
40-50%
50-60%
60-70%
70-80%
|
Gore
40-50%
50-60%
60-70%
|
|
|
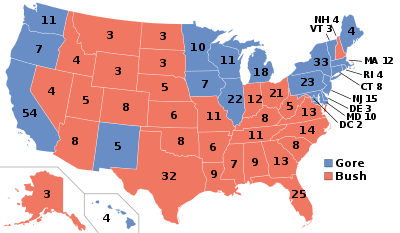
The 2000 United States presidential election in West Virginia took place on November 7, 2000, and was part of the 2000 United States presidential election. Voters chose 5 representatives, or electors to the Electoral College, who voted for president and vice president.
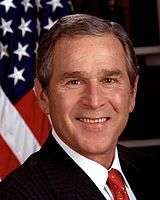
West Virginia gave its 5 electoral votes to Governor George W. Bush, the first time a Republican carried this state since 1984 and only the fourth time since 1932. Bush won the statewide results by a margin of 6.3%. As of the 2016 presidential election, this is the last election in which the Democratic candidate won Kanawha County, Harrison County, Lincoln County, and Wyoming County. This is the 1st time since 1928 that a republican candidate, who was not the incumbent president, won West Virginia.
Primaries
- West Virginia Democratic primary, 2000
- West Virginia Republican primary, 2000
Results
By congressional district
Bush won two of the three congressional districts.[1]
By county
| County |
Gore% |
Gore# |
Bush% |
Bush# |
Others% |
Others# |
Total |
| Barbour County | 41.37% | 2,503 | 56.37% | 3,411 | 2.26% | 137 | 6,051 |
| Berkeley County | 38.23% | 8,797 | 59.19% | 13,619 | 2.58% | 594 | 23,010 |
| Boone County | 61.88% | 5,656 | 36.68% | 3,353 | 1.44% | 132 | 9,141 |
| Braxton County | 51.03% | 2,719 | 47.47% | 2,529 | 1.50% | 80 | 5,328 |
| Brooke County | 49.74% | 4,678 | 44.60% | 4,195 | 5.66% | 532 | 9,405 |
| Cabell County | 46.24% | 14,896 | 51.03% | 16,440 | 2.73% | 880 | 32,216 |
| Calhoun County | 42.52% | 1,112 | 54.49% | 1,425 | 2.98% | 78 | 2,615 |
| Clay County | 45.14% | 1,617 | 52.68% | 1,887 | 2.18% | 78 | 3,582 |
| Doddridge County | 27.45% | 773 | 69.42% | 1,955 | 3.13% | 88 | 2,816 |
| Fayette County | 57.26% | 8,371 | 40.34% | 5,897 | 2.40% | 351 | 14,619 |
| Gilmer County | 39.85% | 1,092 | 56.93% | 1,560 | 3.21% | 88 | 2,740 |
| Grant County | 19.65% | 891 | 78.76% | 3,571 | 1.59% | 72 | 4,534 |
| Greenbrier County | 43.93% | 5,627 | 53.61% | 6,866 | 2.46% | 315 | 12,808 |
| Hampshire County | 33.93% | 2,069 | 63.62% | 3,879 | 2.44% | 149 | 6,097 |
| Hancock County | 46.39% | 6,249 | 47.94% | 6,458 | 5.68% | 765 | 13,472 |
| Hardy County | 35.91% | 1,621 | 62.38% | 2,816 | 1.71% | 77 | 4,514 |
| Harrison County | 48.95% | 13,009 | 48.72% | 12,948 | 2.34% | 621 | 26,578 |
| Jackson County | 42.86% | 4,937 | 55.05% | 6,341 | 2.08% | 240 | 11,518 |
| Jefferson County | 47.71% | 6,860 | 49.00% | 7,045 | 3.29% | 473 | 14,378 |
| Kanawha County | 50.25% | 38,524 | 48.01% | 36,809 | 1.74% | 1,337 | 76,670 |
| Lewis County | 38.39% | 2,355 | 58.79% | 3,606 | 2.82% | 173 | 6,134 |
| Lincoln County | 52.77% | 3,939 | 45.40% | 3,389 | 1.82% | 136 | 7,464 |
| Logan County | 61.83% | 8,927 | 36.94% | 5,334 | 1.23% | 178 | 14,439 |
| Marion County | 53.84% | 12,315 | 43.60% | 9,972 | 2.56% | 586 | 22,873 |
| Marshall County | 44.45% | 6,000 | 50.81% | 6,859 | 4.73% | 639 | 13,498 |
| Mason County | 44.22% | 4,963 | 53.21% | 5,972 | 2.57% | 288 | 11,223 |
| McDowell County | 66.34% | 4,845 | 32.15% | 2,348 | 1.51% | 110 | 7,303 |
| Mercer County | 44.22% | 8,347 | 54.07% | 10,206 | 1.71% | 322 | 18,875 |
| Mineral County | 34.15% | 3,341 | 63.18% | 6,180 | 2.67% | 261 | 9,782 |
| Mingo County | 60.23% | 6,049 | 38.49% | 3,866 | 1.27% | 128 | 10,043 |
| Monongalia County | 46.05% | 12,603 | 49.68% | 13,595 | 4.27% | 1,169 | 27,367 |
| Monroe County | 40.75% | 2,094 | 57.21% | 2,940 | 2.04% | 105 | 5,139 |
| Morgan County | 33.59% | 1,939 | 63.05% | 3,639 | 3.36% | 194 | 5,772 |
| Nicholas County | 47.31% | 4,059 | 50.81% | 4,359 | 1.88% | 161 | 8,579 |
| Ohio County | 42.60% | 7,653 | 53.48% | 9,607 | 3.92% | 704 | 17,964 |
| Pendleton County | 36.39% | 1,172 | 61.97% | 1,996 | 1.65% | 53 | 3,221 |
| Pleasants County | 39.50% | 1,267 | 58.73% | 1,884 | 1.78% | 57 | 3,208 |
| Pocahontas County | 40.15% | 1,392 | 56.82% | 1,970 | 3.03% | 105 | 3,467 |
| Preston County | 33.67% | 3,515 | 63.29% | 6,607 | 3.04% | 317 | 10,439 |
| Putnam County | 38.63% | 7,891 | 59.60% | 12,173 | 1.77% | 362 | 20,426 |
| Raleigh County | 45.91% | 11,047 | 52.31% | 12,587 | 1.77% | 427 | 24,061 |
| Randolph County | 42.21% | 4,028 | 55.00% | 5,248 | 2.79% | 266 | 9,542 |
| Ritchie County | 26.86% | 1,024 | 71.27% | 2,717 | 1.86% | 71 | 3,812 |
| Roane County | 41.46% | 2,332 | 56.39% | 3,172 | 2.15% | 121 | 5,625 |
| Summers County | 48.78% | 2,299 | 48.89% | 2,304 | 2.33% | 110 | 4,713 |
| Taylor County | 43.29% | 2,473 | 54.69% | 3,124 | 2.01% | 115 | 5,712 |
| Tucker County | 39.42% | 1,319 | 57.83% | 1,935 | 2.75% | 92 | 3,346 |
| Tyler County | 30.91% | 1,214 | 65.73% | 2,582 | 3.36% | 132 | 3,928 |
| Upshur County | 34.10% | 2,770 | 63.58% | 5,165 | 2.31% | 188 | 8,123 |
| Wayne County | 48.89% | 7,940 | 49.21% | 7,993 | 1.90% | 308 | 16,241 |
| Webster County | 53.33% | 1,764 | 44.86% | 1,484 | 1.81% | 60 | 3,308 |
| Wetzel County | 45.31% | 2,849 | 51.51% | 3,239 | 3.18% | 200 | 6,288 |
| Wirt County | 34.34% | 818 | 63.73% | 1,518 | 1.93% | 46 | 2,382 |
| Wood County | 37.40% | 12,664 | 60.34% | 20,428 | 2.26% | 765 | 33,857 |
| Wyoming County | 54.44% | 4,289 | 44.08% | 3,473 | 1.47% | 116 | 7,878 |
See also
|
|---|
| Candidates | | |
|---|
General
articles | |
|---|
Local
results | |
|---|
Other 2000
elections | |
|---|