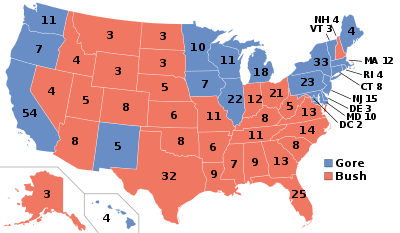
The 2000 United States presidential election in Tennessee took place on November 7, 2000, and was part of the 2000 United States presidential election. Voters chose 11 representatives, or electors to the Electoral College, who voted for president and vice president.
Tennessee was won by Governor George W. Bush by a 3.87% margin of victory, despite having voted for Clinton in 1992 & 1996 and being the home state of Vice President Al Gore. If Vice President Gore had carried his home state, he, instead of Bush, would have been elected President. [1]
This was the first time a major-party candidate lost his home state since George McGovern lost South Dakota in 1972. This was the first election where a presidential candidate won the state with more than a million votes. As of the 2016 presidential election, this is the last election in which Campbell County, Lewis County, Robertson County, Gibson County, Dickson County, Bedford County, Franklin County, Warren County, Henry County, Marshall County, Giles County, Marion County, White County, Hickman County, DeKalb County, Crockett County, Cannon County, and Decatur County voted for the Democratic candidate.
Electors
The electors of each state and the District of Columbia met on December 18, 2000[2] to cast their votes for president and vice president. The Electoral College itself never meets as one body. Instead the electors from each state and the District of Columbia met in their respective capitols.
The following were the members of the Electoral College from the state. All were pledged to and voted for George Bush and Dick Cheney:[3]
- Lamar Alexander
- Daniel Dirksen Baker
- Lana Bowman Ball
- Nancy Cunningham
- Winfield Dunn
- Jimmy Exum
- Jim Henry
- Raja Jubran
- Anie Kent
- Patti Saliba
- Mamon Wright
Results
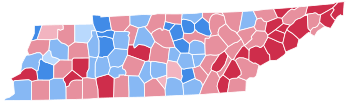
By county
| County |
Gore% |
Gore# |
Bush% |
Bush# |
Others% |
Others# |
Total |
| Anderson County | 47.10% | 13,556 | 51.04% | 14,688 | 01.86% | 535 | 28,779 |
| Bedford County | 50.27% | 6,136 | 48.42% | 5,911 | 01.31% | 160 | 12,207 |
| Benton County | 58.63% | 3,700 | 39.36% | 2,484 | 02.01% | 127 | 6,311 |
| Bledsoe County | 41.85% | 1,756 | 56.72% | 2,380 | 01.43% | 60 | 4,196 |
| Blount County | 36.12% | 14,688 | 62.15% | 25,273 | 01.72% | 701 | 40,662 |
| Bradley County | 29.78% | 8,768 | 68.50% | 20,167 | 01.73% | 508 | 29,443 |
| Campbell County | 52.27% | 6,492 | 46.57% | 5,784 | 01.17% | 145 | 12,421 |
| Cannon County | 57.42% | 2,697 | 40.96% | 1,924 | 01.62% | 76 | 4,697 |
| Carroll County | 48.39% | 5,239 | 50.48% | 5,465 | 01.14% | 123 | 10,827 |
| Carter County | 35.20% | 6,724 | 63.40% | 12,111 | 01.40% | 267 | 19,102 |
| Cheatham County | 48.05% | 6,062 | 50.38% | 6,356 | 01.57% | 198 | 12,616 |
| Chester County | 38.27% | 2,192 | 60.88% | 3,487 | 00.86% | 49 | 5,728 |
| Claiborne County | 42.68% | 3,841 | 55.81% | 5,023 | 01.51% | 136 | 9,000 |
| Clay County | 56.10% | 1,931 | 42.65% | 1,468 | 01.25% | 43 | 3,442 |
| Cocke County | 37.82% | 3,872 | 60.41% | 6,185 | 01.78% | 182 | 10,239 |
| Coffee County | 49.14% | 8,741 | 49.40% | 8,788 | 01.46% | 259 | 17,788 |
| Crockett County | 49.72% | 2,705 | 49.19% | 2,676 | 01.08% | 59 | 5,440 |
| Cumberland County | 40.20% | 7,644 | 57.81% | 10,994 | 01.99% | 379 | 19,017 |
| Davidson County | 57.77% | 120,508 | 40.33% | 84,117 | 01.90% | 3,963 | 208,588 |
| Decatur County | 52.13% | 2,278 | 46.82% | 2,046 | 01.05% | 46 | 4,370 |
| DeKalb County | 60.10% | 3,765 | 38.48% | 2,411 | 01.42% | 89 | 6,265 |
| Dickson County | 53.56% | 8,332 | 45.10% | 7,016 | 01.34% | 208 | 15,556 |
| Dyer County | 45.82% | 5,425 | 53.05% | 6,282 | 01.13% | 134 | 11,841 |
| Fayette County | 43.69% | 5,037 | 55.53% | 6,402 | 00.78% | 90 | 11,529 |
| Fentress County | 41.95% | 2,529 | 56.68% | 3,417 | 01.38% | 83 | 6,029 |
| Franklin County | 53.28% | 7,828 | 44.65% | 6,560 | 02.06% | 303 | 14,691 |
| Gibson County | 50.55% | 8,663 | 48.35% | 8,286 | 01.10% | 188 | 17,137 |
| Giles County | 54.91% | 5,527 | 43.48% | 4,377 | 01.61% | 162 | 10,066 |
| Grainger County | 38.12% | 2,361 | 60.48% | 3,746 | 01.40% | 87 | 6,194 |
| Greene County | 37.99% | 7,909 | 60.24% | 12,540 | 01.76% | 367 | 20,816 |
| Grundy County | 64.62% | 2,970 | 33.79% | 1,553 | 01.59% | 73 | 4,596 |
| Hamblen County | 38.40% | 7,564 | 60.02% | 11,824 | 01.58% | 311 | 19,699 |
| Hamilton County | 42.95% | 51,708 | 55.33% | 66,605 | 01.72% | 2,066 | 120,379 |
| Hancock County | 33.25% | 690 | 64.72% | 1,343 | 02.02% | 42 | 2,075 |
| Hardeman County | 56.26% | 4,953 | 42.36% | 3,729 | 01.37% | 121 | 8,803 |
| Hardin County | 42.53% | 3,735 | 56.38% | 4,951 | 01.09% | 96 | 8,782 |
| Hawkins County | 39.50% | 6,753 | 58.90% | 10,071 | 01.60% | 274 | 17,098 |
| Haywood County | 60.00% | 3,887 | 39.43% | 2,554 | 00.57% | 37 | 6,478 |
| Henderson County | 37.69% | 3,166 | 61.35% | 5,153 | 00.95% | 80 | 8,399 |
| Henry County | 49.50% | 6,093 | 48.29% | 5,944 | 02.21% | 272 | 12,309 |
| Hickman County | 58.36% | 4,239 | 40.12% | 2,914 | 01.53% | 111 | 7,264 |
| Houston County | 66.55% | 2,081 | 31.76% | 993 | 01.69% | 53 | 3,127 |
| Humphreys County | 62.94% | 4,205 | 35.73% | 2,387 | 01.33% | 89 | 6,681 |
| Jackson County | 69.50% | 3,304 | 29.11% | 1,384 | 01.39% | 66 | 4,754 |
| Jefferson County | 37.10% | 5,226 | 61.45% | 8,657 | 01.45% | 204 | 14,087 |
| Johnson County | 32.05% | 1,813 | 66.11% | 3,740 | 01.84% | 104 | 5,657 |
| Knox County | 40.49% | 60,969 | 57.68% | 86,851 | 01.84% | 2,766 | 150,586 |
| Lake County | 63.80% | 1,419 | 35.12% | 781 | 01.08% | 24 | 2,224 |
| Lauderdale County | 55.45% | 4,224 | 43.70% | 3,329 | 00.85% | 65 | 7,618 |
| Lawrence County | 45.91% | 6,643 | 52.61% | 7,613 | 01.48% | 214 | 14,470 |
| Lewis County | 51.61% | 2,281 | 46.09% | 2,037 | 02.31% | 102 | 4,420 |
| Lincoln County | 47.47% | 5,060 | 50.99% | 5,435 | 01.54% | 164 | 10,659 |
| Loudon County | 35.99% | 5,905 | 62.57% | 10,266 | 01.43% | 235 | 16,406 |
| Macon County | 47.13% | 3,059 | 51.86% | 3,366 | 01.02% | 66 | 6,491 |
| Madison County | 46.51% | 15,781 | 52.64% | 17,862 | 00.85% | 287 | 33,930 |
| Marion County | 53.08% | 5,441 | 45.38% | 4,651 | 01.54% | 158 | 10,250 |
| Marshall County | 54.57% | 5,107 | 43.86% | 4,105 | 01.57% | 147 | 9,359 |
| Maury County | 47.55% | 11,127 | 50.98% | 11,930 | 01.47% | 343 | 23,400 |
| McMinn County | 37.00% | 6,142 | 61.17% | 10,155 | 01.83% | 303 | 16,600 |
| McNairy County | 44.53% | 4,003 | 54.48% | 4,897 | 00.99% | 89 | 8,989 |
| Meigs County | 45.87% | 1,555 | 53.01% | 1,797 | 01.12% | 38 | 3,390 |
| Monroe County | 40.97% | 5,327 | 57.79% | 7,514 | 01.25% | 162 | 13,003 |
| Montgomery County | 48.20% | 18,818 | 50.31% | 19,644 | 01.49% | 582 | 39,044 |
| Moore County | 48.11% | 1,107 | 49.76% | 1,145 | 02.13% | 49 | 2,301 |
| Morgan County | 47.40% | 2,921 | 51.02% | 3,144 | 01.57% | 97 | 6,162 |
| Obion County | 48.68% | 6,056 | 49.58% | 6,168 | 01.74% | 216 | 12,440 |
| Overton County | 60.13% | 4,507 | 38.35% | 2,875 | 01.52% | 114 | 7,496 |
| Perry County | 57.57% | 1,650 | 40.65% | 1,165 | 01.78% | 51 | 2,866 |
| Pickett County | 41.94% | 939 | 57.21% | 1,281 | 00.85% | 19 | 2,239 |
| Polk County | 46.01% | 2,574 | 51.97% | 2,907 | 02.02% | 113 | 5,594 |
| Putnam County | 48.07% | 10,785 | 50.13% | 11,248 | 01.80% | 405 | 22,438 |
| Rhea County | 38.09% | 3,722 | 60.38% | 5,900 | 01.53% | 150 | 9,772 |
| Roane County | 44.90% | 9,575 | 53.20% | 11,345 | 01.90% | 406 | 21,326 |
| Robertson County | 50.83% | 10,249 | 47.98% | 9,675 | 01.19% | 240 | 20,164 |
| Rutherford County | 44.00% | 27,360 | 53.79% | 33,445 | 02.21% | 1,377 | 62,182 |
| Scott County | 44.85% | 2,967 | 54.10% | 3,579 | 01.04% | 69 | 6,615 |
| Sequatchie County | 42.40% | 1,648 | 55.80% | 2,169 | 01.80% | 70 | 3,887 |
| Sevier County | 32.36% | 8,208 | 65.97% | 16,734 | 01.67% | 423 | 25,365 |
| Shelby County | 56.54% | 190,404 | 42.09% | 141,756 | 01.36% | 4,595 | 336,755 |
| Smith County | 66.47% | 4,884 | 32.44% | 2,384 | 01.09% | 80 | 7,348 |
| Stewart County | 60.02% | 2,870 | 38.18% | 1,826 | 01.80% | 86 | 4,782 |
| Sullivan County | 38.32% | 21,354 | 60.08% | 33,482 | 01.60% | 891 | 55,727 |
| Sumner County | 43.82% | 22,118 | 54.68% | 27,601 | 01.50% | 758 | 50,477 |
| Tipton County | 38.06% | 6,300 | 60.84% | 10,070 | 01.10% | 182 | 16,552 |
| Trousdale County | 66.76% | 1,966 | 32.26% | 950 | 00.98% | 29 | 2,945 |
| Unicoi County | 39.91% | 2,566 | 58.80% | 3,780 | 01.29% | 83 | 6,429 |
| Union County | 44.05% | 2,564 | 54.96% | 3,199 | 01.00% | 58 | 5,821 |
| Van Buren County | 58.89% | 1,255 | 39.65% | 845 | 01.45% | 31 | 2,131 |
| Warren County | 56.19% | 7,378 | 42.28% | 5,552 | 01.53% | 201 | 13,131 |
| Washington County | 38.93% | 14,769 | 59.51% | 22,579 | 01.57% | 594 | 37,942 |
| Wayne County | 35.04% | 1,859 | 63.51% | 3,370 | 01.45% | 77 | 5,306 |
| Weakley County | 47.03% | 5,570 | 51.55% | 6,106 | 01.42% | 168 | 11,844 |
| White County | 53.18% | 4,135 | 45.34% | 3,525 | 01.48% | 115 | 7,775 |
| Williamson County | 32.08% | 18,745 | 66.58% | 38,901 | 01.34% | 783 | 58,429 |
| Wilson County | 46.11% | 16,561 | 52.47% | 18,844 | 01.42% | 511 | 35,916 |
See also
|
|---|
| Candidates | | |
|---|
General
articles | |
|---|
Local
results | |
|---|
Other 2000
elections | |
|---|