United States presidential election in Nebraska, 2000
|
| ||||||||||||||||||||||||||
| ||||||||||||||||||||||||||
| ||||||||||||||||||||||||||
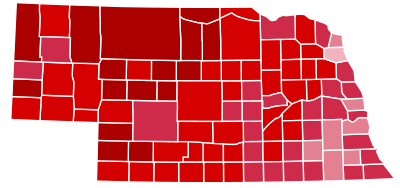 County Results
Bush 40-50%
50-60%
60-70%
70-80%
80-90% | ||||||||||||||||||||||||||
| ||||||||||||||||||||||||||

| Elections in Nebraska |
|---|
 |
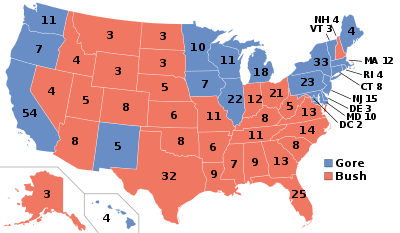
The 2000 United States presidential election in Nebraska took place on November 7, 2000, and was part of the 2000 United States presidential election. Voters chose 5 representatives, or electors to the Electoral College, who voted for president and vice president.
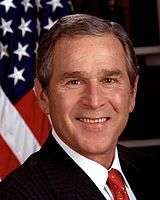
Nebraska was won by Governor George W. Bush by a 29% margin of victory, winning every county. Also, with 62.25% of the popular vote, the state proved to be his fourth strongest state in the 2000 election after Wyoming, Idaho and Utah[1].
Electors
The electors of each state and the District of Columbia met on December 18, 2000[2] to cast their votes for president and vice president. The Electoral College itself never meets as one body. Instead the electors from each state and the District of Columbia met in their respective capitols.
The following were the members of the Electoral College from the state. All were pledged to and voted for George Bush and Dick Cheney:[3]
- Mary Johnson
- Lee Terry, Sr.
- Howard Lamb
- Mildred Curtis
- John Y. McCollister
Results
| United States presidential election in Nebraska, 2000[4] | |||||
|---|---|---|---|---|---|
| Party | Candidate | Votes | Percentage | Electoral votes | |
| Republican | George W. Bush | 433,862 | 62.25% | 5 | |
| Democratic | Al Gore | 231,780 | 33.25% | 0 | |
| Green | Ralph Nader | 24,540 | 3.52% | 0 | |
| Reform | Pat Buchanan | 3,646 | 0.52% | 0 | |
| Libertarian | Harry Browne | 2,245 | 0.32% | 0 | |
Congressional District
Bush won all three congressional districts.[5]
| district | Bush | Gore | Representative |
|---|---|---|---|
| 1st | 59% | 36% | Doug Bereuter |
| 2nd | 57% | 39% | Lee Terry |
| 3rd | 71% | 25% | Bill Barrett |
| Tom Osborne | |||
By county
| County | Gore% | Gore# | Bush% | Bush# | Others% | Others# | Total |
|---|---|---|---|---|---|---|---|
| Adams County | 29.63% | 3,686 | 65.62% | 8,162 | 4.74% | 590 | 12,438 |
| Antelope County | 20.13% | 678 | 76.07% | 2,562 | 3.8% | 128 | 3,368 |
| Arthur County | 09.56% | 26 | 86.40% | 235 | 4.04% | 11 | 272 |
| Banner County | 14.07% | 65 | 84.42% | 390 | 1.52% | 7 | 462 |
| Blaine County | 12.32% | 43 | 85.67% | 299 | 2.01% | 7 | 349 |
| Boone County | 20.09% | 575 | 76.73% | 2,196 | 3.18% | 91 | 2,862 |
| Box Butte County | 31.72% | 1,614 | 63.04% | 3,208 | 5.25% | 267 | 5,089 |
| Boyd County | 21.34% | 265 | 74.96% | 931 | 3.7% | 46 | 1,242 |
| Brown County | 14.85% | 250 | 81.65% | 1,375 | 3.5% | 59 | 1,684 |
| Buffalo County | 23.86% | 3,927 | 72.48% | 11,931 | 3.66% | 603 | 16,461 |
| Burt County | 36.06% | 1,223 | 60.61% | 2,056 | 3.33% | 113 | 3,392 |
| Butler County | 26.85% | 1,028 | 68.91% | 2,638 | 4.23% | 162 | 3,828 |
| Cass County | 35.56% | 3,656 | 59.77% | 6,144 | 4.67% | 480 | 10,280 |
| Cedar County | 24.88% | 1,062 | 70.02% | 2,989 | 5.11% | 218 | 4,269 |
| Chase County | 16.32% | 306 | 80.27% | 1,505 | 3.41% | 64 | 1,875 |
| Cherry County | 15.67% | 446 | 81.56% | 2,322 | 2.77% | 79 | 2,847 |
| Cheyenne County | 20.16% | 844 | 76.61% | 3,207 | 3.23% | 135 | 4,186 |
| Clay County | 24.07% | 774 | 72.35% | 2,326 | 3.58% | 115 | 3,215 |
| Colfax County | 26.03% | 863 | 70.53% | 2,338 | 3.44% | 114 | 3,315 |
| Cuming County | 20.33% | 857 | 76.68% | 3,232 | 2.99% | 126 | 4,215 |
| Custer County | 18.03% | 976 | 78.41% | 4,245 | 3.56% | 193 | 5,414 |
| Dakota County | 44.46% | 2,695 | 51.46% | 3,119 | 4.08% | 247 | 6,061 |
| Dawes County | 22.73% | 823 | 70.39% | 2,549 | 6.88% | 249 | 3,621 |
| Dawson County | 23.18% | 1,740 | 73.41% | 5,511 | 3.41% | 256 | 7,507 |
| Deuel County | 20.62% | 213 | 75.80% | 783 | 3.58% | 37 | 1,033 |
| Dixon County | 29.37% | 820 | 65.69% | 1,834 | 4.94% | 138 | 2,792 |
| Dodge County | 34.69% | 5,021 | 61.30% | 8,871 | 4.01% | 580 | 14,472 |
| Douglas County | 40.05% | 73,347 | 55.16% | 101,025 | 4.8% | 8,784 | 183,156 |
| Dundy County | 17.71% | 179 | 79.23% | 801 | 3.07% | 31 | 1,011 |
| Fillmore County | 28.29% | 848 | 67.51% | 2,024 | 4.2% | 126 | 2,998 |
| Franklin County | 25.18% | 420 | 71.70% | 1,196 | 3.12% | 52 | 1,668 |
| Frontier County | 17.52% | 244 | 79.11% | 1,102 | 3.37% | 47 | 1,393 |
| Furnas County | 21.97% | 534 | 76.06% | 1,849 | 1.97% | 48 | 2,431 |
| Gage County | 36.99% | 3,516 | 58.26% | 5,538 | 4.75% | 452 | 9,506 |
| Garden County | 16.65% | 203 | 79.00% | 963 | 4.35% | 53 | 1,219 |
| Garfield County | 20.98% | 202 | 74.56% | 718 | 4.47% | 43 | 963 |
| Gosper County | 22.49% | 228 | 74.65% | 757 | 2.86% | 29 | 1,014 |
| Grant County | 12.73% | 49 | 84.16% | 324 | 3.12% | 12 | 385 |
| Greeley County | 31.76% | 416 | 64.05% | 839 | 4.2% | 55 | 1,310 |
| Hall County | 32.09% | 5,952 | 63.64% | 11,803 | 4.27% | 791 | 18,546 |
| Hamilton County | 23.74% | 1,066 | 72.39% | 3,251 | 3.87% | 174 | 4,491 |
| Harlan County | 23.65% | 438 | 73.33% | 1,358 | 3.02% | 56 | 1,852 |
| Hayes County | 11.56% | 66 | 85.11% | 486 | 3.33% | 19 | 571 |
| Hitchcock County | 21.08% | 312 | 76.08% | 1,126 | 2.84% | 42 | 1,480 |
| Holt County | 17.06% | 846 | 79.73% | 3,954 | 3.21% | 159 | 4,959 |
| Hooker County | 18.09% | 74 | 77.51% | 317 | 4.4% | 18 | 409 |
| Howard County | 33.78% | 955 | 62.26% | 1,760 | 3.96% | 112 | 2,827 |
| Jefferson County | 35.38% | 1,361 | 61.11% | 2,351 | 3.51% | 135 | 3,847 |
| Johnson County | 37.59% | 794 | 57.29% | 1,210 | 5.11% | 108 | 2,112 |
| Kearney County | 21.78% | 680 | 74.73% | 2,333 | 3.49% | 109 | 3,122 |
| Keith County | 20.21% | 778 | 76.72% | 2,953 | 3.07% | 118 | 3,849 |
| Keya Paha County | 15.20% | 78 | 82.26% | 422 | 2.53% | 13 | 513 |
| Kimball County | 20.82% | 379 | 75.77% | 1,379 | 3.41% | 62 | 1,820 |
| Knox County | 26.07% | 1,037 | 69.98% | 2,784 | 3.95% | 157 | 3,978 |
| Lancaster County | 41.68% | 44,650 | 51.82% | 55,514 | 6.5% | 6,968 | 107,132 |
| Lincoln County | 34.44% | 5,205 | 61.00% | 9,220 | 4.56% | 689 | 15,114 |
| Logan County | 14.56% | 60 | 81.55% | 336 | 3.88% | 16 | 412 |
| Loup County | 22.22% | 84 | 75.13% | 284 | 2.65% | 10 | 378 |
| McPherson County | 21.57% | 2,772 | 74.97% | 9,636 | 3.46% | 445 | 12,853 |
| Madison County | 15.95% | 48 | 81.06% | 244 | 2.99% | 9 | 301 |
| Merrick County | 25.39% | 848 | 71.26% | 2,380 | 3.35% | 112 | 3,340 |
| Morrill County | 21.52% | 460 | 74.70% | 1,597 | 3.79% | 81 | 2,138 |
| Nance County | 29.85% | 497 | 66.37% | 1,105 | 3.78% | 63 | 1,665 |
| Nemaha County | 31.55% | 1,063 | 64.62% | 2,177 | 3.83% | 129 | 3,369 |
| Nuckolls County | 26.36% | 644 | 69.63% | 1,701 | 4.01% | 98 | 2,443 |
| Otoe County | 33.14% | 2,208 | 62.71% | 4,178 | 4.14% | 276 | 6,662 |
| Pawnee County | 34.36% | 522 | 61.69% | 937 | 3.95% | 60 | 1,519 |
| Perkins County | 16.74% | 243 | 80.58% | 1,170 | 2.69% | 39 | 1,452 |
| Phelps County | 20.19% | 934 | 77.26% | 3,575 | 2.55% | 118 | 4,627 |
| Pierce County | 17.77% | 570 | 78.99% | 2,534 | 3.24% | 104 | 3,208 |
| Platte County | 20.31% | 2,612 | 76.69% | 9,861 | 3.% | 386 | 12,859 |
| Polk County | 23.34% | 610 | 73.67% | 1,925 | 2.99% | 78 | 2,613 |
| Red Willow County | 23.64% | 1,188 | 73.23% | 3,680 | 3.12% | 157 | 5,025 |
| Richardson County | 33.30% | 1,382 | 63.20% | 2,623 | 3.49% | 145 | 4,150 |
| Rock County | 15.77% | 141 | 81.10% | 725 | 3.13% | 28 | 894 |
| Saline County | 45.11% | 2,321 | 50.17% | 2,581 | 4.72% | 243 | 5,145 |
| Sarpy County | 32.33% | 14,637 | 64.00% | 28,979 | 3.67% | 1,662 | 45,278 |
| Saunders County | 31.98% | 2,852 | 63.77% | 5,688 | 4.25% | 379 | 8,919 |
| Scotts Bluff County | 28.45% | 3,937 | 67.90% | 9,397 | 3.65% | 505 | 13,839 |
| Seward County | 32.07% | 2,250 | 63.53% | 4,457 | 4.4% | 309 | 7,016 |
| Sheridan County | 15.22% | 392 | 81.72% | 2,105 | 3.07% | 79 | 2,576 |
| Sherman County | 33.08% | 564 | 62.87% | 1,072 | 4.05% | 69 | 1,705 |
| Sioux County | 13.03% | 98 | 83.64% | 629 | 3.32% | 25 | 752 |
| Stanton County | 20.11% | 500 | 76.23% | 1,895 | 3.66% | 91 | 2,486 |
| Thayer County | 27.31% | 821 | 69.73% | 2,096 | 2.96% | 89 | 3,006 |
| Thomas County | 13.92% | 55 | 83.29% | 329 | 2.78% | 11 | 395 |
| Thurston County | 44.38% | 924 | 49.95% | 1,040 | 5.67% | 118 | 2,082 |
| Valley County | 25.76% | 583 | 71.14% | 1,610 | 3.09% | 70 | 2,263 |
| Washington County | 29.56% | 2,550 | 66.75% | 5,758 | 3.69% | 318 | 8,626 |
| Wayne County | 25.41% | 1,001 | 70.41% | 2,774 | 4.19% | 165 | 3,940 |
| Webster County | 30.03% | 584 | 66.94% | 1,302 | 3.03% | 59 | 1,945 |
| Wheeler County | 18.76% | 85 | 77.48% | 351 | 3.75% | 17 | 453 |
| York County | 21.78% | 1,407 | 74.55% | 4,816 | 3.67% | 237 | 6,460 |
References
- ↑ "2000 Presidential Election Statistics". Dave Leip’s Atlas of U.S. Presidential Elections. Retrieved 2018-03-05.
- ↑ http://uselectionatlas.org/RESULTS/state.php?year=2000&fips=42&f=0&off=0&elect=0
- ↑ http://presidentelect.org/e2000.html
- ↑ http://uselectionatlas.org/RESULTS/index.html
- ↑ http://www.swingstateproject.com/diary/4161/